Zenith RSI Volume Review — Volume Indicator
Zenith RSI Volume Pro review: a multi-engine intraday tool that fuses RSI, relative volume, structure and ATR risk into trade setups with fixed levels.
🔬 Go Deeper Than One Indicator
You're reading about Zenith RSI Volume Review — Volume Indicator. Imagine 123 indicators voting on 20 markets, every 15 minutes, right to your phone. No more conflicting signals.
7-day free trial · Cancel anytime · No credit card to start
Most “RSI + volume” scripts on TradingView are one idea wearing a costume: an oscillator crossover with a volume histogram bolted on and an arrow where they happen to line up. Zenith RSI Volume Pro is not that. It’s a modular decision-support tool that runs several independent analytical engines and refuses to print a signal until enough of them agree. Whether that discipline is worth the complexity is the real question here.
What it actually does
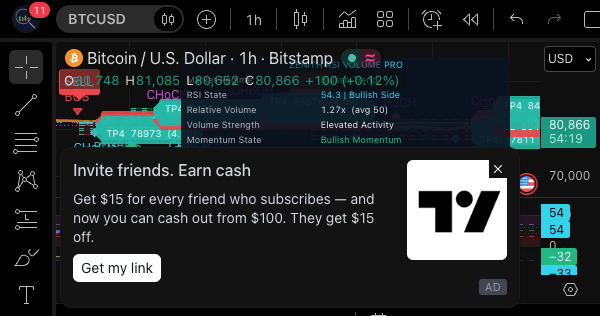
The indicator evaluates five things in parallel: RSI momentum, relative volume, market structure, trend regime, and candle/volatility behaviour. Each engine scores its own slice of the market, and a confluence engine combines them into separate bullish and bearish scores from 0 to 100. A trade setup only appears when a valid price-action pattern exists and the momentum, participation, stop and reward checks all pass on a closed candle.
The author is explicit about one thing that matters: RSI crossing 50 or touching 70/30 never triggers a signal by itself. Overbought and oversold readings are treated as context only. That’s a more honest framing than most retail indicators offer, and it sets the tone for the whole script.
The engines, briefly
- RSI Momentum — RSI (default length 14) with slope, acceleration and position relative to the 30/40/50/60/70 levels. Confirmation can be set to Midpoint Cross, Sustained Above/Below, or Flexible. Optional divergence is detected via confirmed pivots and drawn in the RSI pane.
- Smart Relative Volume — RVOL against a selectable average (SMA/EMA/WMA/RMA, default SMA 20), classified into activity tiers with configurable thresholds, plus absorption detection and a z-score for anomalies. If a symbol has no usable volume, volume confirmation is switched off automatically rather than faked — a detail I appreciate.
- Market Structure — confirmed swing highs/lows, BOS and CHoCH labels, retests and liquidity sweeps.
- Trend & Regime — EMA 9/21/50, optional ADX, ATR volatility check and an optional higher-timeframe EMA filter. Classifies the market as trending, range-bound, low momentum or unstable.
- Confluence Scoring — weighted 0–100 scores (default weights: RSI 25, RVOL 20, Structure 25, Trend 15, Candle 15), normalised automatically.
Four setup types can be toggled: breakout/breakdown, breakout retest, liquidity sweep reversal, and trend continuation. SELL setups mirror BUYs.
The part that earns its keep: trade management
Where this script separates itself from the arrow-painting crowd is the trade engine. Every confirmed setup gets a reference Entry, a Stop Loss and four Take Profit levels, all calculated by one documented method and fixed once created.
The default stop is hybrid: the latest relevant confirmed swing plus an ATR buffer, with fallbacks to ATR-only if the stop is too wide, widened if too tight, and the setup rejected entirely if the stop is invalid. Targets are R-multiples (1–4) that snap just before nearby structure when one exists. The setup is rejected if reward-to-TP2 falls below the minimum risk-to-reward (default 1.5). Every price is rounded to tick size and is the exact value the engine uses.
The setup is then tracked through its lifecycle: ACTIVE, TP1–TP4 HIT, STOP HIT, INVALIDATED, EXPIRED. When stop and target are both touched inside one candle, the conservative rule applies — stop assumed first, event flagged as ambiguous. That single decision tells you the author thought about edge cases rather than optimising for a pretty screenshot.
How you’d actually use it
The author lays out a sensible workflow: check regime and HTF trend first, then structure, then the RSI panel, then the volume band, then compare the bullish and bearish scores, then inspect the zones for sensible distance and reward. The dashboard surfaces all of this — regime, RSI state, RVOL, momentum state, both scores, signal mode, current setup, R:R, structure, HTF trend, session. A separate statistics section counts outcomes across loaded history.
One caveat the source states plainly and you should too: those statistics are indicator-level counts. They don’t include spread, commission or slippage, and they are not a Strategy Tester backtest. Treat them as a description of past signal behaviour, not an edge.
Pros & Cons
Pros
- Genuinely multi-factor — signals require agreement across independent engines, not one crossover.
- Transparent, documented level calculation with fixed stops and targets.
- Honest about limitations: tick volume on Forex/gold, reference-price entries, delayed pivot confirmation, the score being a rating not a probability.
- Automatic volume handling when a symbol lacks usable volume.
- Rich alert set: confirmed BUY/SELL, high-confluence signals, each TP, stop, invalidation, divergence, exceptional volume.
Cons
- Heavy. This is a lot of settings across a dozen input groups; the learning curve is real.
- Signals appear only after bar close, and HTF confirmation adds delay by design — not a scalping-the-tick tool.
- The dashboard plus volume band plus RSI pane is dense, especially on lower timeframes.
- Defaults are tuned for XAUUSD intraday; other symbols will need adjustment, and the author says so.
Who it’s for
Intraday discretionary traders — particularly gold and major-FX traders on M5 through H1 — who already understand structure and volume and want a consistent, rules-based second opinion on entries, stops and targets. It is not for set-and-forget automation, and beginners will likely drown in the settings before they read the dashboard properly.
FAQ
Does it repaint? Signals and setup management are processed only on confirmed bar closes. Pivots and divergence are confirmed with a delay equal to the pivot length — that’s a confirmation delay, not repainting, but you’ll see it.
Can I use it on stocks or crypto? Nothing is hard-coded to gold; distances adapt via ATR and tick size. The author notes settings that work on one symbol may not suit another.
Does the score mean win probability? No. The source is explicit: a 90 is a technical rating, not a 90% chance of success.
Does it place trades? No. It’s analysis only.
Verdict
Zenith RSI Volume Pro is a serious, well-documented attempt at the “one pane, full context” problem. The confluence logic, fixed levels, conservative same-candle rule and honest disclaimers put it well above the typical arrow script. It loses a star for sheer complexity and the tuning burden across symbols — but if you trade XAUUSD intraday and want structure, volume and risk handled in one consistent framework, it’s a strong candidate. ⭐⭐⭐⭐
Analysis tool only — not financial advice. Test on demo before risking capital.
Go Deeper with The Indicator Lab
🔬 The Lab Report — 123 indicators. 20 markets. One consensus verdict every 15 minutes. Stop guessing which indicator to trust.
📈 The Lab Edge — Time-Series Momentum across 166 markets. The same framework institutions use. Weekly signals to your phone.
📊 Prefer to trade on your own? Power your analysis on TradingView — the platform behind every review on this site.
Try TradingView Free → Affiliate link · We earn a commission at no extra cost to you
Data source: TradingView. This review is based on publicly available indicator information and the official TradingView script documentation. Always test indicators in a demo environment before live trading.
123 indicators is too many to watch. One is too few to trust.
Zenith RSI Volume Review — Volume Indicator is one opinion. The Lab Report gives you the consensus of 123 — delivered to your phone every 15 minutes. No chart clutter required.
What is the Lab Report? See how the consensus engine works →
Know WHAT to buy. Now know WHEN.
The Lab Edge runs Time-Series Momentum — the same framework institutions use — across 166 markets, 95% profitable in backtesting. One signal. Once a week. No indicators to configure.
Upgrade to Pro
LAB ORIGINALThis free trend, technical analysis indicators work — but if you want phone alerts, multi-timeframe scanning, and zero repaint, here's what we built:
🔬 Are you the developer of this indicator? Email us →