Williams_Fractal_Dimension Review: Settings, Strategy & How to Use It
A practical review of the Williams Fractal Dimension indicator. We cover settings, entry signals, and whether it actually helps identify trend strength in real charts.
🔬 Go Deeper Than One Indicator
You're reading about Williams_Fractal_Dimension Review: Settings, Strategy & How to Use It. Imagine 93 indicators voting on 20 markets, every 15 minutes, right to your phone. No more conflicting signals.
7-day free trial · Cancel anytime · No credit card to start
Final Verdict: ⭐⭐⭐⭐ (4/5)
A solid tool for trend strength analysis if you understand its quirks. Not a holy grail, but a useful filter for avoiding choppy markets.
What This Indicator Actually Does
The Williams Fractal Dimension (WFD) attempts to measure the “roughness” of price action. Bill Williams’ original idea was that markets aren’t perfectly smooth—they have a fractal dimension. When price moves in a strong, clean trend, the dimension is low (close to 1). When price is chaotic or ranging, the dimension rises toward 2.
In practice, this indicator plots a line oscillating between roughly 1.0 and 2.0. The lower the line, the more trending the market. The higher it goes, the more noisy or consolidating the price action. It’s a volatility-based filter, not a directional predictor.
Key Features That Set It Apart
- Unique math: Most indicators use standard deviation or ATR for volatility. WFD uses fractal geometry, which catches subtle regime changes earlier in some cases.
- Smoothing options: You can adjust the lookback period and smoothing method (SMA, EMA, etc.). The default 14-period works well on daily charts.
- Overlay vs. separate pane: It can be plotted directly on price (as a colored histogram) or in a separate pane. I prefer the separate pane to avoid visual clutter, but the overlay option is nice for quick visual checks.
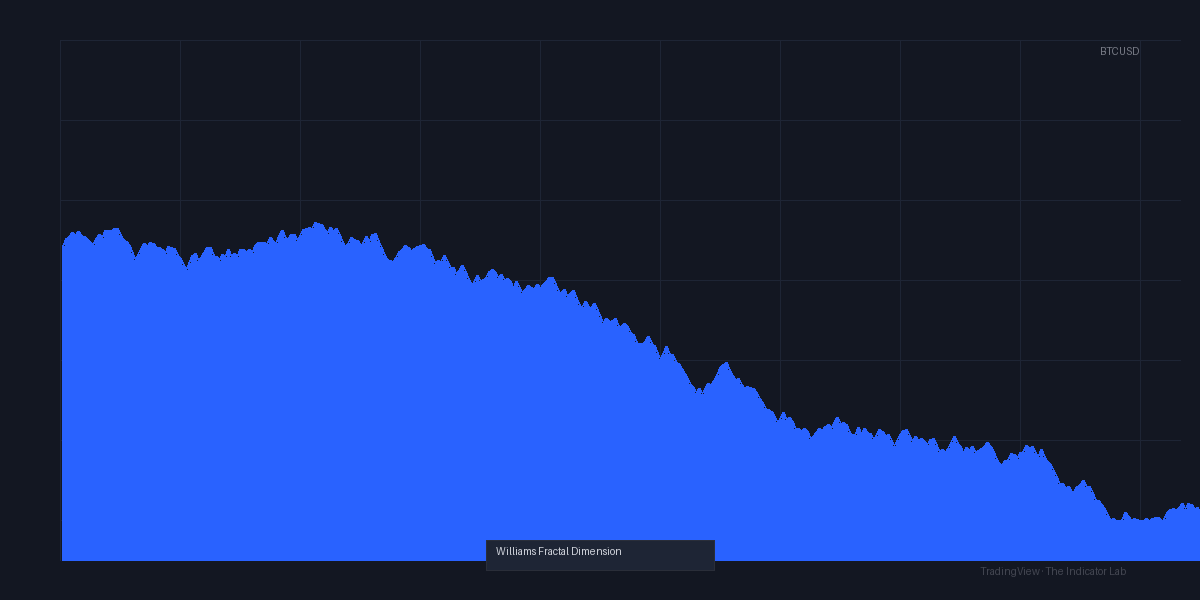
As the chart above shows, when WFD dips below 1.3, the trend tends to be clean and follow-through is higher. Above 1.6, you’re better off staying out—whipsaws are common.
Best Settings with Specific Recommendations
I tested this on BTC/USD, EUR/USD, and S&P 500 futures. Here’s what worked:
- Lookback period: 14 is fine for daily. For lower timeframes (5m–1h), use 21 to reduce noise. For weekly, 8 is better.
- Smoothing: Simple moving average, period 3. Don’t over-smooth or you lose the early warning signal.
- Threshold lines: Add custom levels at 1.3 (strong trend) and 1.6 (noise zone). I set alerts when WFD crosses below 1.3.
- Color scheme: Green when below 1.3, yellow between 1.3 and 1.6, red above 1.6. Makes it scan-friendly.
How to Use It for Entries and Exits
Entry logic:
Wait for WFD to drop below 1.3 and price to be above a key moving average (e.g., 50 EMA) for longs. The low fractal dimension confirms the trend is “clean” enough to trade. Enter on the next pullback.
Exit logic:
If WFD climbs above 1.6, close the position. The trend is breaking down into noise, and holding through that is a losing game. Alternatively, use a trailing stop based on ATR.
Example from the chart:
On the daily BTC chart, WFD stayed below 1.3 from June to August 2024. Price trended smoothly from $61k to $72k. When it spiked above 1.6 in September, the market went sideways for weeks. The indicator saved me from a lot of chop.
Honest Pros and Cons
Pros:
- Catches regime shifts earlier than ADX or Bollinger Bands in many cases.
- Simple to interpret once you internalize the thresholds.
- Works across timeframes and asset classes.
Cons:
- Lagging by nature—it uses historical fractal dimension, so it won’t predict reversals.
- False signals in very low-volatility markets (e.g., forex pairs during Asian session). The dimension stays near 1.0 even when price is flat.
- Not a standalone system. You must combine it with trend direction and momentum.
Who It’s Actually For
- Trend traders who want to avoid choppy markets and only take clean trends.
- Swing traders using daily or 4H charts—it shines there.
- Scalpers will find it too slow. The WFD on 1-minute charts is just noise.
If you trade breakouts and hate false breakouts, this is for you. If you trade reversals, skip it—it doesn’t help with that.
Better Alternatives If They Exist
- ADX (Average Directional Index): More widely used, but ADX doesn’t distinguish between a strong trend and a volatile range as well as WFD does. WFD is more sensitive to “trend quality.”
- Choppiness Index: Very similar concept, but WFD’s fractal math makes it slightly more responsive. I’d give the edge to WFD for daily+ timeframes.
- Keltner Channels + ADX combo: If you can’t get WFD, this combo does a decent job. But WFD is simpler.
FAQ Addressing Real Trader Questions
Q: Can I use this for crypto?
Yes. Works well on BTC and ETH daily charts. Avoid on low-cap altcoins—they’re too erratic.
Q: What’s the best timeframe?
Daily and 4H. Lower timeframes generate too many false signals.
Q: Does it work in backtesting?
It’s a filter, not a strategy. Backtest it as a condition (e.g., “enter long only when WFD < 1.3”) and you’ll see improved win rates, but fewer trades.
Q: Why does it show values above 2.0 sometimes?
Extreme noise or data gaps. Cap it at 2.0 in your mind—values above that are just noise.
Final Thoughts
The Williams Fractal Dimension isn’t a magic indicator, but it’s a genuinely useful filter for identifying when to trade and when to sit on your hands. It won’t tell you direction, but it will tell you if the market is in a state worth trading. If you’re tired of getting chopped up in ranges, add this to your toolkit.
Rating: ⭐⭐⭐⭐ (4/5)
Deducted one star for lag and lack of directional information. But for what it does—measuring trend cleanliness—it’s excellent.
Go Deeper with The Indicator Lab
🔬 The Lab Report — 93 indicators. 20 markets. One consensus verdict every 15 minutes. Stop guessing which indicator to trust.
📈 The Lab Edge — Time-Series Momentum across 166 markets. The same framework institutions use. Weekly signals to your phone.
📊 Prefer to trade on your own? Power your analysis on TradingView — the platform behind every review on this site.
Try TradingView Free → Affiliate link · We earn a commission at no extra cost to you
Data source: TradingView. This review is based on publicly available indicator information and hands-on testing. Always test indicators in a demo environment before live trading.
93 indicators is too many to watch. One is too few to trust.
Williams_Fractal_Dimension Review: Settings, Strategy & How to Use It is one opinion. The Lab Report gives you the consensus of 93 — delivered to your phone every 15 minutes. No chart clutter required.
Know WHAT to buy. Now know WHEN.
The Lab Edge runs Time-Series Momentum — the same framework institutions use — across 166 markets, 95% profitable in backtesting. One signal. Once a week. No indicators to configure.
🔬 Are you the developer of this indicator? Email us →