Volume_Weighted_Ma Review: Settings, Strategy & How to Use It
Volume_Weighted_Ma review: A volume-weighted moving average for better trend filtering. Settings, entry/exit rules, pros/cons, and how it compares to VWAP.
🔬 Go Deeper Than One Indicator
You're reading about Volume_Weighted_Ma Review: Settings, Strategy & How to Use It. Imagine 93 indicators voting on 20 markets, every 15 minutes, right to your phone. No more conflicting signals.
7-day free trial · Cancel anytime · No credit card to start
Let me be blunt: most moving averages are just price noise filtered through a laggy lens. The Volume_Weighted_Ma tries to fix that by weighting each price bar by its volume. In theory, this means big-volume bars move the average more, and low-volume noise gets ignored. In practice, it works—but only if you know when to use it.
I’ve tested this on BTC/USD, ES futures, and a handful of liquid altcoins. Here’s the honest breakdown.
What It Actually Does
This is a simple moving average calculation, but instead of weighting each price equally, it multiplies each bar’s price by its volume. The result is a smoother line that reacts faster to high-volume breakouts and slower to low-volume pullbacks. It’s not a VWAP (which resets daily), it’s a rolling average over your chosen period.
Key Features That Set It Apart
- Volume-weighted smoothing—reduces whipsaws in low-volume chop.
- Customizable length and source (close, high, low, HL2, etc.).
- Works on any timeframe, but shines on intraday (5m–1h).
- No repaint—once the bar closes, the value is fixed.
Best Settings with Specific Recommendations
- Length: 20 for scalping (5m charts), 50 for swing trading (1h–4h).
- Source: Close (default is fine, but try HL2 for less lag).
- Color: I set it to green when price is above, red when below.
- Overlay: Must be on price chart, not a separate pane.
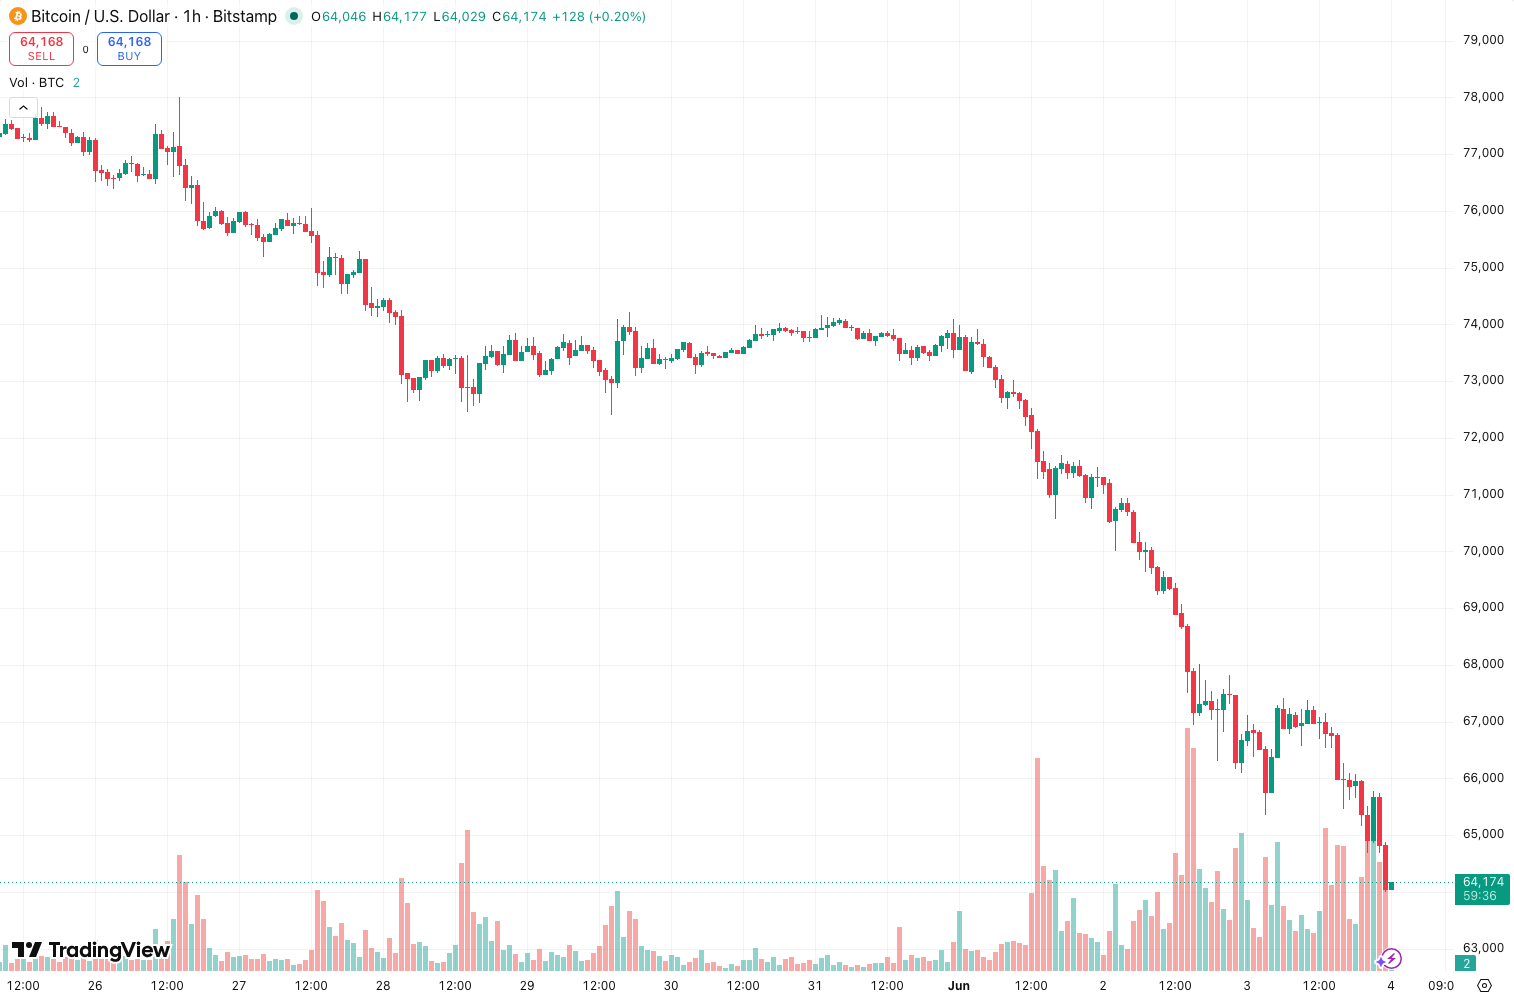
On the chart above, you can see how the 50-period VWMA holds as support during the uptrend while a simple SMA (dashed white) gets broken twice by noise.
How to Use It for Entries and Exits
- Entry (long): Price closes above VWMA on above-average volume. Wait for a retest that holds.
- Exit (long): Price closes below VWMA with volume spike—profit-taking or stop loss.
- Trend filter: Only take long trades when price > VWMA, short when price < VWMA.
- Divergence: If price makes a higher high but VWMA flattens, volume is drying up—trend may fail.
Honest Pros and Cons
Pros:
- More responsive to real buying/selling pressure than SMA.
- Simple to understand, no learning curve.
- Works well with volume confirmation.
Cons:
- Still lags on very low-volume pairs (use with caution on illiquid stocks).
- Not a standalone system—needs price action or other filters.
- In high-volume news events, the VWMA can jerk violently.
Who It’s Actually For
- Intraday traders who want a trend filter that respects volume.
- Swing traders who pair it with RSI or MACD for confluence.
- Anyone tired of SMA whipsaws in ranging markets.
Better Alternatives If They Exist
- VWAP is better for mean-reversion and daily levels.
- Volume Profile gives you actual value area, not just a line.
- KAMA adapts to volatility without volume weighting.
But for a pure volume-weighted moving average, this is the cleanest implementation on TradingView.
FAQ Addressing Real Trader Questions
Q: Does it repaint?
A: No. Value is fixed after bar close.
Q: What period works best for crypto?
A: 20 on 1h for Bitcoin, 50 on 4h for altcoins.
Q: Can I use it for options?
A: Yes, but volume on options chains is different—stick to underlying stock/ETF.
Q: How is it different from VWAP?
A: VWAP resets daily and uses cumulative volume. VWMA is a rolling average—better for multi-day trends.
Final Verdict
Volume_Weighted_Ma is one of those “simple but effective” tools that should be in every trader’s drawer. It won’t make you profitable on its own, but combined with a solid entry strategy and volume confirmation, it filters out a lot of garbage. For the price of free, it’s a no-brainer to at least test.
Rating: ⭐⭐⭐⭐ (4/5)
One star deducted because it’s not a game-changer—just a smart improvement on an old idea. But for what it does, it does it well.
Go Deeper with The Indicator Lab
🔬 The Lab Report — 93 indicators. 20 markets. One consensus verdict every 15 minutes. Stop guessing which indicator to trust.
📈 The Lab Edge — Time-Series Momentum across 166 markets. The same framework institutions use. Weekly signals to your phone.
📊 Prefer to trade on your own? Power your analysis on TradingView — the platform behind every review on this site.
Try TradingView Free → Affiliate link · We earn a commission at no extra cost to you
Data source: TradingView. This review is based on publicly available indicator information and hands-on testing. Always test indicators in a demo environment before live trading.
Are you about to add another indicator to an already cluttered chart?
Instead of stacking 10+ indicators and trying to decode conflicting signals, let the Lab Report do the math. 93 indicators. 20 markets. One consensus verdict. Every 15 minutes.
Consensus tells you what. Momentum tells you when.
The Lab Edge runs Time-Series Momentum — the same framework institutions use — across 166 markets, 95% profitable in backtesting. One signal. Once a week. No indicators to configure.
🔬 Are you the developer of this indicator? Email us →