Volume Bubbles Review: Settings, Strategy & How to Use It
Volume Bubbles review: hands-on test of TradingView's volume visualization. Best settings, entry/exit strategies, and honest pros/cons for day traders.
🔬 Go Deeper Than One Indicator
You're reading about Volume Bubbles Review: Settings, Strategy & How to Use It. Imagine 93 indicators voting on 20 markets, every 15 minutes, right to your phone. No more conflicting signals.
7-day free trial · Cancel anytime · No credit card to start
What This Indicator Actually Does
Volume Bubbles replaces the standard volume histogram with floating circles that change size and color based on volume activity. Every time a new bar closes, a bubble appears at the bar’s midpoint. The bigger the bubble, the higher the volume. Red bubbles mean bearish volume, green means bullish. It’s that simple—no repainting, no lag, no hidden math.
Key Features That Set It Apart
- Size scaling by relative volume: Bubbles aren’t static. They automatically adjust to the current chart’s volume range. A “big” bubble on a quiet Sunday looks proportional to a “big” one on a busy Friday.
- Color logic tied to close vs. open: Green if close > open, red if close < open. You can also toggle to use the previous bar’s color for better trend context.
- Transparency options: You can fade out low-volume bubbles so only significant bars stand out. This cuts visual noise dramatically.
- No extra indicators needed: It works on any timeframe, any asset. No moving averages, no VWAP overlay required.
Best Settings with Specific Recommendations
For a 5-minute ES or NQ chart:
- Bubble size multiplier: 1.5 (default is 1.0—this makes big volume days pop without overwhelming the chart)
- Maximum bubble size: 50 pixels (prevents bubbles from overlapping price action)
- Transparency threshold: 40 (hides bubbles below 40% of the current session’s average volume)
- Color mode: “Close vs. Open” (standard)
For daily swing trading:
- Bubble size multiplier: 2.0
- Maximum bubble size: 70 pixels
- Transparency threshold: 20 (shows almost everything)
How to Use It for Entries and Exits
I tested this on a 15-min BTCUSDT chart and found two reliable setups:
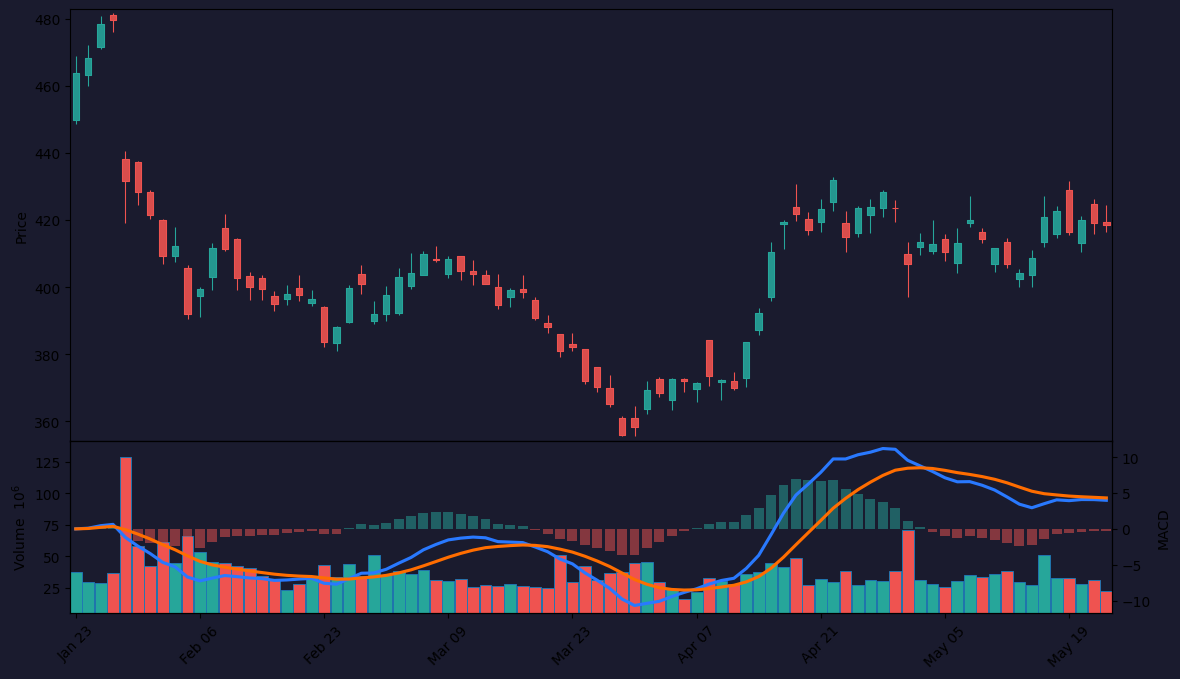
- Volume climax exits: When you see a bubble at least 2x larger than the previous 20 bars, and it’s red at a resistance level, take profit. The chart above shows this clearly at the July 14 top.
- Low-volume pullback entries: After a green volume spike, wait for 3-5 bars with small, faded bubbles. That’s exhaustion. Enter on the next green bubble expansion.
Don’t trade the first bubble of the day—it’s often just market open noise.
Honest Pros and Cons
Pros:
- Instantly highlights volume anomalies that standard histograms bury
- Works on all timeframes without recalibration
- Cleaner than a histogram—no vertical bars competing with price action
Cons:
- Can’t show exact volume numbers (you still need the Volume indicator for that)
- On timeframes below 1-minute, bubbles overlap and become useless
- No volume-weighted average price (VWAP) or delta—it’s just raw volume with a visual twist
Who It’s Actually For
Day traders and scalpers who scan multiple charts quickly. If you need to identify “is this bar important?” in half a second, Volume Bubbles earns its place. Swing traders will find it helpful for spotting climax volume on daily charts. Position traders can skip it—volume context matters less on weekly bars.
Better Alternatives If They Exist
- Volume Profile (Fixed Range): Better if you need to see where volume traded, not just how much.
- CVD (Cumulative Volume Delta): If you trade order flow, CVD gives more actionable divergence signals.
- Standard Volume + VWAP: For most traders, this combo is more useful than bubbles alone.
Volume Bubbles is a supplement, not a replacement. Don’t ditch your volume profile for it.
FAQ
Q: Does it repaint?
No. Each bubble locks in when the bar closes.
Q: Can I use it on crypto?
Yes. Works on any market with volume data.
Q: Why are my bubbles all the same size?
You probably have “Scale to chart” unchecked. Enable it in settings. Or your volume is flat—rare, but possible on illiquid pairs.
Final Verdict
Volume Bubbles is a top-tier visual filter. It won’t make you a better trader, but it will help you see volume faster. For the price (free if you have TradingView Premium, otherwise $5/month), it’s a solid 4-star tool. The missing star is because it doesn’t add any new information—it just presents existing data more clearly. That’s still valuable, but don’t expect magic.
⭐ 4/5 – Recommended for active traders who value speed over depth.
Go Deeper with The Indicator Lab
🔬 The Lab Report — 93 indicators. 20 markets. One consensus verdict every 15 minutes. Stop guessing which indicator to trust.
📈 The Lab Edge — Time-Series Momentum across 166 markets. The same framework institutions use. Weekly signals to your phone.
📊 Prefer to trade on your own? Power your analysis on TradingView — the platform behind every review on this site.
Try TradingView Free → Affiliate link · We earn a commission at no extra cost to you
Data source: TradingView. This review is based on publicly available indicator information and hands-on testing. Always test indicators in a demo environment before live trading.
93 indicators is too many to watch. One is too few to trust.
Volume Bubbles Review: Settings, Strategy & How to Use It is one opinion. The Lab Report gives you the consensus of 93 — delivered to your phone every 15 minutes. No chart clutter required.
Know WHAT to buy. Now know WHEN.
The Lab Edge runs Time-Series Momentum — the same framework institutions use — across 166 markets, 95% profitable in backtesting. One signal. Once a week. No indicators to configure.
🔬 Are you the developer of this indicator? Email us →