SMC Buyer Seller Liquidity Profile Pro Review
A no-fluff look at SMC Buyer Seller Liquidity Profile Pro — what this Smart Money Concepts liquidity tool actually does and who it suits.
🔬 Go Deeper Than One Indicator
You're reading about SMC Buyer Seller Liquidity Profile Pro Review. Imagine 123 indicators voting on 20 markets, every 15 minutes, right to your phone. No more conflicting signals.
7-day free trial · Cancel anytime · No credit card to start
Most “SMC” tools on TradingView are repackaged order blocks with a fresh coat of paint. This one takes a different angle: it’s built around liquidity — where buyers and sellers have left their footprints — rather than another set of trend arrows. That distinction is the whole reason it’s worth a look.
What it actually does
The name is the pitch. “SMC” signals Smart Money Concepts, “Buyer & Seller Liquidity” points to the idea of mapping where resting orders cluster, and “Profile” suggests a distribution-style view of that activity rather than a single line on the chart. In plain terms, the indicator is designed to visualise the liquidity landscape — the zones where one side of the book has been dominant — so you can judge whether a move is running into supply, demand, or open air.
It sits in the Trend category, but don’t read that as a signal generator. The concept is contextual: it tells you about the terrain, and you decide how to trade it.
The core idea, and why it matters
Smart Money Concepts traders will recognise the logic immediately. Price doesn’t move in a vacuum — it moves toward liquidity, sweeps it, and then either continues or reverses. The hard part has always been seeing where that liquidity sits before the sweep happens, not after.
A profile-style approach addresses that by aggregating buyer and seller activity into a structured view instead of drawing a box and hoping. That’s a meaningfully different workflow from the standard “here’s an order block, here’s a fair value gap” toolkit. If your current SMC setup is a wall of rectangles, this offers a cleaner conceptual frame.
How you’d use it
The honest workflow is confirmation, not prediction. You read the liquidity profile to understand where the market is likely to find responsive buyers or sellers, then look to your own price-action read — structure, break of structure, a sweep — to time entries into or away from those areas.
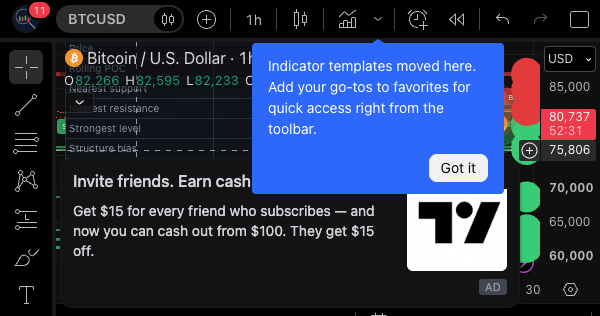
As shown in the chart above, the profile framing works best as a backdrop layer. It’s the kind of tool you keep visible while you trade your existing plan, not the thing that fires the trade for you. Treat it as a map, and the map is only as good as the trader reading it.
Pros and cons
Pros
- Addresses liquidity directly, which is closer to how SMC is actually taught than most indicator clones.
- The profile concept gives structure to buyer/seller positioning rather than a binary signal.
- Fits naturally into an existing SMC or price-action workflow as a context layer.
Cons
- It’s contextual by nature — anyone expecting buy/sell arrows will be disappointed.
- “Liquidity profile” is an interpretation of chart data, not a view into the real order book, so read it as a proxy.
- Learners new to SMC concepts may find the profile view takes time to interpret before it pays off.
Who it’s for
Discretionary SMC and price-action traders who already read structure and want a liquidity lens on top. Swing and intraday traders who plan entries around sweeps and reactive zones will get the most from it. It’s a poor fit for mechanical, signal-driven systems and for anyone who wants the indicator to make the decision.
FAQ
Is this a buy/sell signal indicator? No. It’s a contextual tool for reading buyer and seller liquidity, not an alert that tells you to enter.
Does it show the real order book? No indicator on TradingView can. It interprets price and volume behaviour into a liquidity profile — a proxy, not exchange depth.
Can beginners use it? They can, but it assumes some familiarity with Smart Money Concepts and liquidity sweeps. Without that foundation the output is hard to act on.
Does it replace price action? No. It informs it. The entry decision still belongs to you.
Verdict
SMC Buyer Seller Liquidity Profile Pro earns its place by doing something slightly different from the SMC crowd: framing the market through liquidity rather than another order-block overlay. It won’t hand you trades, and it shouldn’t be mistaken for a real order-book view, but as a context layer for traders who already know how to read structure, it’s a genuinely useful addition.
Four stars — not a holy grail, but a well-aimed tool for the right trader.
Rating: ⭐⭐⭐⭐ (4/5)
Go Deeper with The Indicator Lab
🔬 The Lab Report — 123 indicators. 20 markets. One consensus verdict every 15 minutes. Stop guessing which indicator to trust.
📈 The Lab Edge — Time-Series Momentum across 166 markets. The same framework institutions use. Weekly signals to your phone.
📊 Prefer to trade on your own? Power your analysis on TradingView — the platform behind every review on this site.
Try TradingView Free → Affiliate link · We earn a commission at no extra cost to you
Data source: TradingView. This review is based on publicly available indicator information and the official TradingView script documentation. Always test indicators in a demo environment before live trading.
123 indicators is too many to watch. One is too few to trust.
SMC Buyer Seller Liquidity Profile Pro Review is one opinion. The Lab Report gives you the consensus of 123 — delivered to your phone every 15 minutes. No chart clutter required.
What is the Lab Report? See how the consensus engine works →
Know WHAT to buy. Now know WHEN.
The Lab Edge runs Time-Series Momentum — the same framework institutions use — across 166 markets, 95% profitable in backtesting. One signal. Once a week. No indicators to configure.
Upgrade to Pro
LAB ORIGINALThis free trend, technical analysis indicators work — but if you want phone alerts, multi-timeframe scanning, and zero repaint, here's what we built:
🔬 Are you the developer of this indicator? Email us →