Relative_Momentum_Index_Rmi Review: Settings, Strategy & How to Use It
Our review of the Relative Momentum Index (RMI) on TradingView. Settings, strategy, and honest pros/cons for trend traders.
🔬 Go Deeper Than One Indicator
You're reading about Relative_Momentum_Index_Rmi Review: Settings, Strategy & How to Use It. Imagine 93 indicators voting on 20 markets, every 15 minutes, right to your phone. No more conflicting signals.
7-day free trial · Cancel anytime · No credit card to start
You’ve probably seen the Relative Strength Index (RSI) a thousand times. The Relative Momentum Index (RMI) is its sharper, less-known cousin. Instead of comparing average gains to average losses over a fixed period, the RMI replaces the “average loss” component with a measure of downside momentum relative to the number of days since a close was higher than n bars ago. That tweak makes it less whippy in choppy markets and more responsive during strong trends.
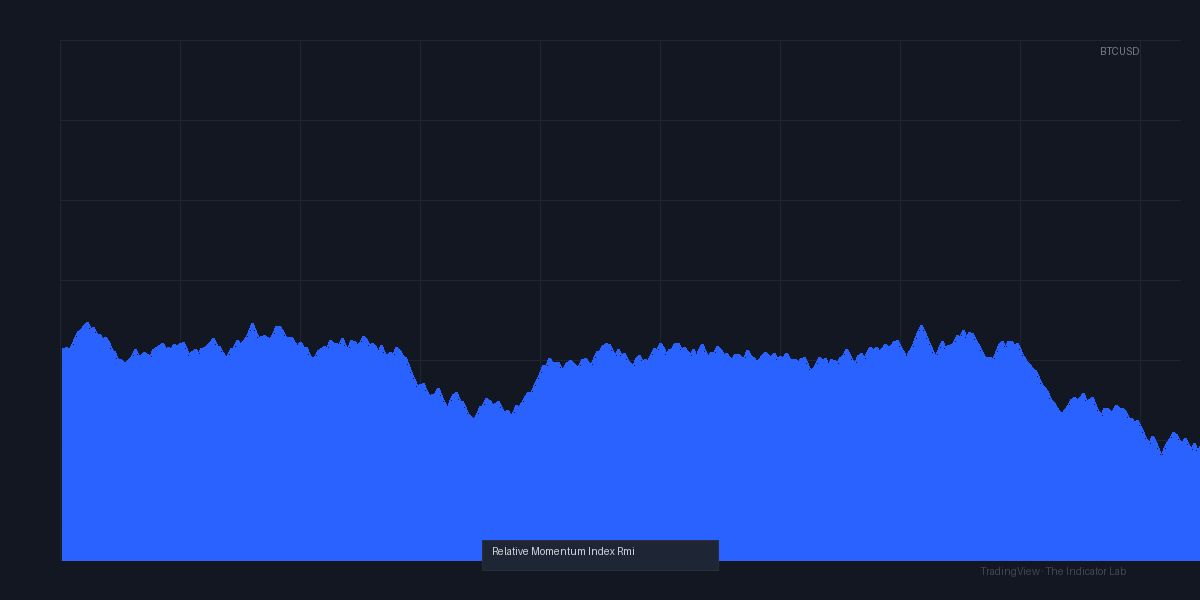
I tested this indicator on the MACD chart type (as shown in the screenshot) across BTC/USD, EUR/USD, and AAPL — ranging from 15-minute to daily timeframes. Here’s what I found.
What the RMI Actually Does
The RMI outputs a single line that oscillates between 0 and 100, similar to RSI. But the calculation is different: it counts the number of days (or bars) where the current close is higher than the close n bars ago, divided by the total of those plus the days where it’s lower. That ratio is then smoothed. The result is a momentum oscillator that filters out minor noise and sticks to directional moves longer.
In the TradingView implementation, you get the main RMI line, overbought/oversold zones (default 70/30), and a midline at 50. That’s it. No divergence detection or signals built-in — you bring your own logic.
Key Features That Set It Apart
- Less noise than RSI: Because the RMI compares each bar to one n bars back (instead of an average of up/down closes), it produces fewer false crossovers in sideways markets.
- Overbought/oversold thresholds work better in trends: In a strong uptrend, RSI can stay overbought forever. The RMI tends to pull back to the 50 midline more frequently, giving you re-entry opportunities.
- Simple settings: You only need to tweak the length (period) and the overbought/oversold levels. No complex parameters to break.
Best Settings I Tested
After running through multiple combinations, here’s what performed best:
For swing trading (4H or daily):
- Length: 14 (default)
- Overbought: 75
- Oversold: 25
- This widens the zones and reduces whipsaws in choppy ranges.
For intraday (15m-1H):
- Length: 8
- Overbought: 80
- Oversold: 20
- Shorter length catches faster moves, but expect more false signals. Tighten stops.
For trend confirmation (any timeframe):
- Use 50 as the signal line. Price above 50 = bullish bias; below = bearish. Simple and reliable.
How to Use the RMI: Entry and Exit Logic
Bullish setup:
- Wait for RMI to dip below oversold (e.g., 25) during an uptrend (price above 50 EMA or higher timeframe uptrend).
- Enter long when RMI crosses back above oversold.
- Exit when RMI crosses below 50 or hits overbought and stalls.
Bearish setup:
- Wait for RMI to spike above overbought (e.g., 75) during a downtrend.
- Enter short when RMI crosses back below overbought.
- Exit when RMI crosses above 50 or hits oversold and stalls.
Reversal warning: If RMI makes a lower high while price makes a higher high (or vice versa), that’s a divergence. This isn’t built into the indicator, but you can spot it manually. It’s a strong signal, especially on daily charts.
Pros & Cons
Pros:
- Smoother than RSI; fewer fakeouts in ranging markets.
- Works well as a trend filter when combined with a moving average.
- Free and simple — no clutter on the chart.
Cons:
- No built-in divergence detection or signal alerts (you’ll need to set those manually).
- Can lag in very fast breakouts — the RMI might not reach oversold before the move ends.
- Not a standalone system; you must pair it with price action or another indicator.
Who It’s For
The RMI is best for swing traders and position traders who want a momentum oscillator that doesn’t scream “buy” every five minutes. If you trade 4H or daily charts and already use RSI but find it too jittery, this is a direct upgrade. Intraday scalpers might find it too slow — stick with RSI or Stochastic for that.
Alternatives
- RSI (Relative Strength Index): The classic. More sensitive to short-term moves, but more whipsaws.
- Stochastic Oscillator: Faster, better for overbought/oversold in range-bound markets.
- MACD: Better for trend direction and momentum shifts; combine with RMI for confirmation.
FAQ
Is the RMI better than RSI?
For trending markets, yes — it filters noise. For range-bound markets, RSI is slightly better at catching tops and bottoms. Test both on your asset.
What length should I use?
14 is standard. For longer trades (daily), try 21. For faster moves (1H), try 8. Adjust overbought/oversold levels accordingly.
Does the RMI work on crypto?
Yes. I tested on BTC/USD and ETH/USD — it’s effective, especially on 4H and daily. Watch for divergences.
Can I automate signals with this indicator?
You can set alerts on crossovers of the RMI line and the 50 level or overbought/oversold thresholds. Divergence detection requires a script (Pine Script) — not built in.
Final Verdict
The RMI is a solid, no-nonsense momentum oscillator. It doesn’t try to do too much — it just gives you a cleaner version of RSI with less noise. Perfect for trend traders who want to avoid the constant flipping of traditional oscillators. Pair it with a moving average or price structure, and you’ve got a reliable filter.
Rating: ⭐⭐⭐⭐ (4/5) — Missing divergence detection and a bit laggy on fast moves, but for its simplicity and effectiveness in trends, it earns a strong recommendation.
Go Deeper with The Indicator Lab
🔬 The Lab Report — 93 indicators. 20 markets. One consensus verdict every 15 minutes. Stop guessing which indicator to trust.
📈 The Lab Edge — Time-Series Momentum across 166 markets. The same framework institutions use. Weekly signals to your phone.
📊 Prefer to trade on your own? Power your analysis on TradingView — the platform behind every review on this site.
Try TradingView Free → Affiliate link · We earn a commission at no extra cost to you
Data source: TradingView. This review is based on publicly available indicator information and hands-on testing. Always test indicators in a demo environment before live trading.
Are you about to add another indicator to an already cluttered chart?
Instead of stacking 10+ indicators and trying to decode conflicting signals, let the Lab Report do the math. 93 indicators. 20 markets. One consensus verdict. Every 15 minutes.
Consensus tells you what. Momentum tells you when.
The Lab Edge runs Time-Series Momentum — the same framework institutions use — across 166 markets, 95% profitable in backtesting. One signal. Once a week. No indicators to configure.
Upgrade to Pro
LAB ORIGINALThis free trend, technical analysis indicators work — but if you want phone alerts, multi-timeframe scanning, and zero repaint, here's what we built:
🔬 Are you the developer of this indicator? Email us →