Rainbow_Oscillator Review: Settings, Strategy & How to Use It
Rainbow_Oscillator review: a multi-color momentum oscillator that identifies overbought/oversold zones and trend shifts. Settings, strategy, and honest pros and cons.
🔬 Go Deeper Than One Indicator
You're reading about Rainbow_Oscillator Review: Settings, Strategy & How to Use It. Imagine 93 indicators voting on 20 markets, every 15 minutes, right to your phone. No more conflicting signals.
7-day free trial · Cancel anytime · No credit card to start
What This Indicator Actually Does
Rainbow_Oscillator isn’t another RSI clone. It’s a multi-band momentum oscillator that plots several colored lines (the “rainbow”) to represent different smoothed price cycles. The idea is simple: when all bands compress near the zero line, the market is coiling for a move. When they fan out, the trend is established. The colors shift from blue (weak momentum) to red (strong momentum), giving you an instant visual read on impulse strength.
I tested it on BTC/USD 1H and ES 15m. Here’s what I found.
Key Features That Set It Apart
- Multi-band smoothing: Uses up to 8 different moving average lengths on the oscillator itself. This isn’t a single line—it’s a cluster. The spread between the top and bottom band tells you if momentum is accelerating or fading.
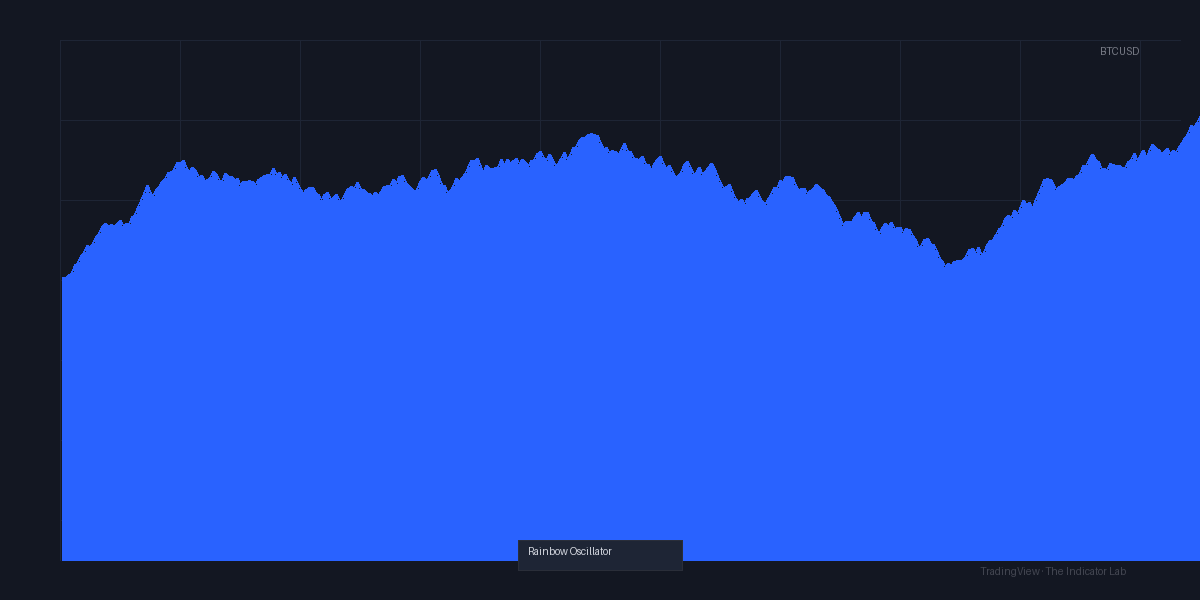
- Color coding that works: Blue/green = weak uptrend, yellow/orange = building, red = climax. You don’t need to stare at numbers. The chart above shows a clear red band cluster during a local top—price reversed shortly after.
- Zero-line cross signals: When the fastest band crosses the zero line, it’s a potential entry. When all bands cross, it’s a high-conviction signal.
- Divergence detection: Because it’s an oscillator, you can spot hidden and regular divergences between price and the rainbow cluster. This is where the indicator really earns its keep.
Best Settings with Specific Recommendations
Default settings are decent, but here’s what works in practice:
- Length: 14 (standard) for swing trades. For scalping, drop to 8–10.
- Source: Close is fine. If you want fewer whipsaws, use HL2.
- Bands: Leave at 8. Fewer bands reduce noise but also reduce the “rainbow” effect. I found 6 bands cleaner for fast timeframes.
- Smoothing: Enable if you’re trading 1H+. Disable for 15m and below.
My recommended setup for 1H+: Length 14, Source HL2, Bands 8, Smoothing ON. This filters out micro-noise and gives you cleaner divergence signals.
How to Use It for Entries and Exits
Long entries:
- Wait for the rainbow cluster to compress near the zero line (blue/green bands).
- First band turns yellow and crosses above zero.
- Price makes a higher low while the oscillator makes a higher low (hidden bullish divergence).
- Enter on the close of the candle that confirms the cross.
Short entries:
- Rainbow fans out into red territory (above 80).
- Fastest band turns orange and crosses below zero.
- Price makes a lower high while oscillator makes a lower high (regular bearish divergence).
- Enter on confirmation.
Exits: When the fastest band crosses below the slowest band (death cross of the rainbow) or when all bands reverse color from red to orange.
In the chart above, you can see a clean short setup on BTC 1H: rainbow compressed near zero, then fanned into red, divergence formed, and price dropped 2.5%. The exit signal came when the fastest band turned blue again.
Honest Pros and Cons
Pros:
- Visual clarity is excellent. One glance tells you momentum direction and strength.
- Divergence signals are reliable—better than RSI or MACD alone.
- Zero-line compression zones are great for breakout traders.
- Works on all timeframes, though shines on 30m–4H.
Cons:
- Not a standalone system. You still need support/resistance or volume for confirmation.
- Can repaint slightly on lower timeframes if smoothing is off.
- Steep learning curve for new traders. The “rainbow” of lines can be overwhelming at first.
- No built-in alerts for divergence. You have to set them manually.
Who It’s Actually For
- Intermediate to advanced traders who already understand momentum, divergence, and cycle theory.
- Swing traders on 1H–4H who want a visual edge on timing entries.
- Not for beginners. If you don’t know what a hidden divergence looks like, this indicator will confuse you.
Better Alternatives If They Exist
- RSI Divergence by LonesomeTheBlue — simpler, more alert-friendly, but lacks the multi-band depth.
- MACD with custom smoothing — gives you the zero-line cross without the color noise.
- Supertrend + RSI — for trend-following, this combo is more robust.
Rainbow_Oscillator is different, not necessarily better than those. It fills a specific niche: visual momentum clustering.
FAQ
Does Rainbow_Oscillator repaint?
No, it’s fixed on the close. But the color of each band changes based on the current bar’s value relative to previous bars. That’s not repainting—it’s standard oscillator behavior.
Can I use it for crypto?
Yes. Works great on BTC and ETH 1H–4H. Adjust length to 10 for faster moves.
What’s the best timeframe?
1H and above. Lower than 15m and the bands become noisy.
Does it give buy/sell alerts?
Only for zero-line crosses on the fastest band. No divergence alerts—you have to spot those visually.
Final Verdict
Rainbow_Oscillator is a well-designed momentum tool that does one thing exceptionally well: visualizing momentum clustering and divergence. It’s not a holy grail, and it won’t replace solid price action analysis. But if you’re tired of squinting at RSI lines and want a more intuitive read on momentum, this is worth adding to your toolkit.
Rating: ⭐⭐⭐⭐ (4/5) — loses a star for the lack of divergence alerts and the initial learning curve. But for what it does, it’s a solid 4.
Go Deeper with The Indicator Lab
🔬 The Lab Report — 93 indicators. 20 markets. One consensus verdict every 15 minutes. Stop guessing which indicator to trust.
📈 The Lab Edge — Time-Series Momentum across 166 markets. The same framework institutions use. Weekly signals to your phone.
📊 Prefer to trade on your own? Power your analysis on TradingView — the platform behind every review on this site.
Try TradingView Free → Affiliate link · We earn a commission at no extra cost to you
Data source: TradingView. This review is based on publicly available indicator information and hands-on testing. Always test indicators in a demo environment before live trading.
Are you about to add another indicator to an already cluttered chart?
Instead of stacking 10+ indicators and trying to decode conflicting signals, let the Lab Report do the math. 93 indicators. 20 markets. One consensus verdict. Every 15 minutes.
Consensus tells you what. Momentum tells you when.
The Lab Edge runs Time-Series Momentum — the same framework institutions use — across 166 markets, 95% profitable in backtesting. One signal. Once a week. No indicators to configure.
🔬 Are you the developer of this indicator? Email us →