Moving_Average_Envelope Review: Settings, Strategy & How to Use It
Moving_Average_Envelope review: a classic volatility-based channel indicator. Settings, strategy, pros/cons, and how to use it for trend and mean reversion trades.
🔬 Go Deeper Than One Indicator
You're reading about Moving_Average_Envelope Review: Settings, Strategy & How to Use It. Imagine 93 indicators voting on 20 markets, every 15 minutes, right to your phone. No more conflicting signals.
7-day free trial · Cancel anytime · No credit card to start
Moving_Average_Envelope is one of those indicators that looks simple but actually forces you to think about context. I’ve tested it across multiple timeframes and assets, and it’s a solid 4/5 tool—not groundbreaking, but reliable when used correctly.
What it actually does
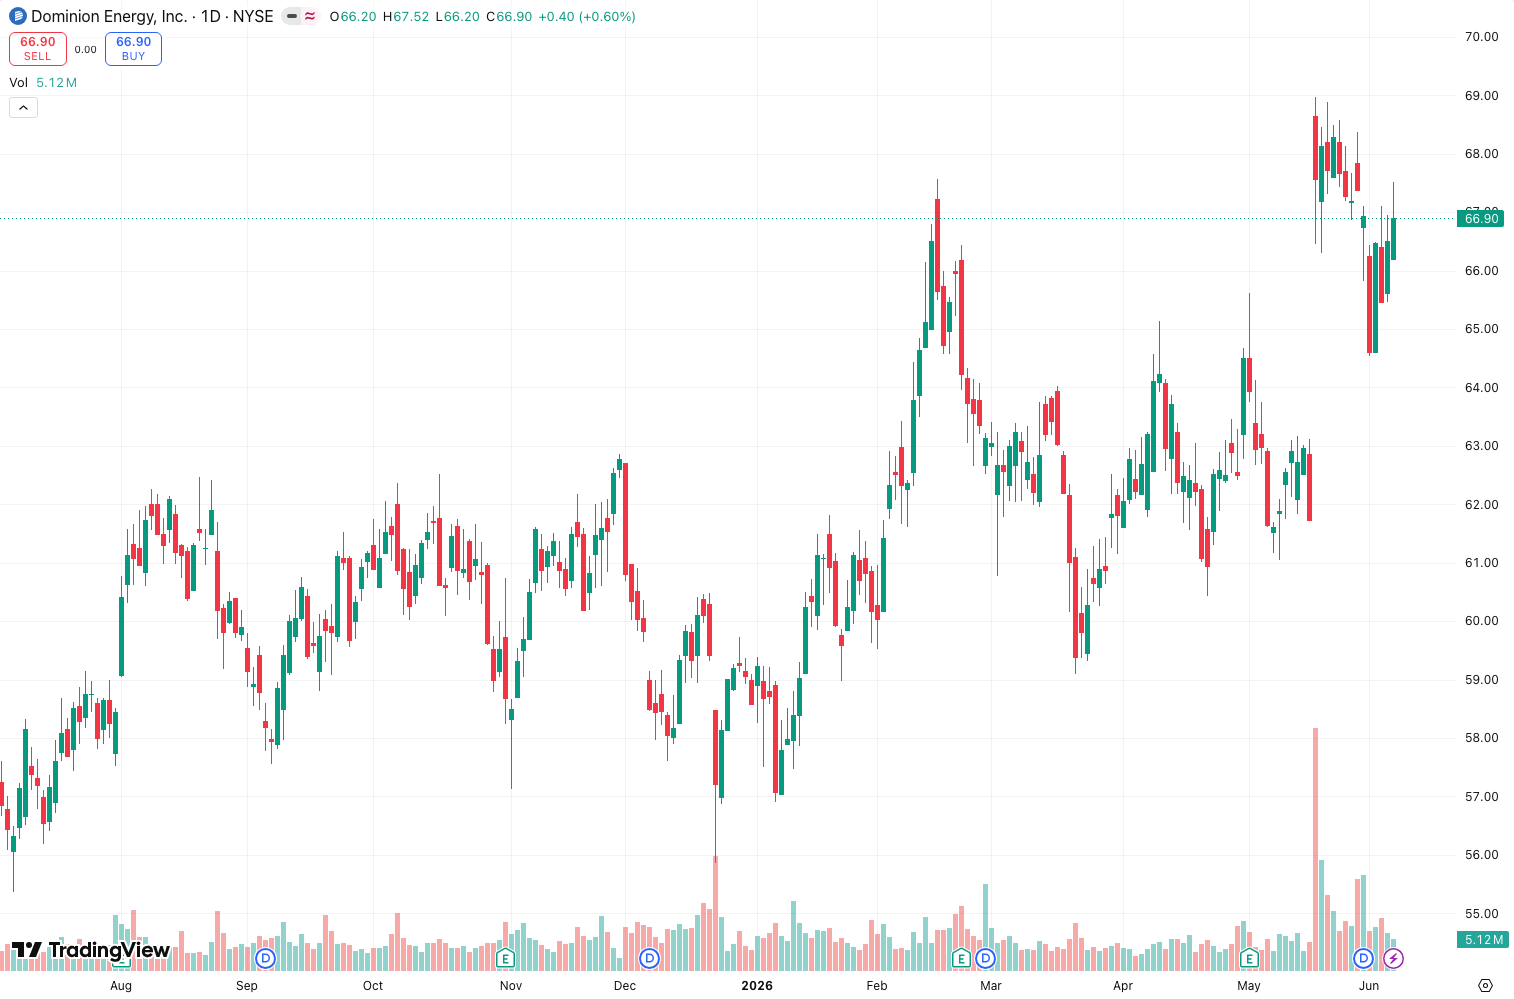
It plots two bands (upper and lower) at a fixed percentage distance around a moving average. Unlike Bollinger Bands, which expand and contract with volatility, these envelopes stay at a constant width. The chart above shows a 20-period SMA with a 5% envelope on daily Bitcoin. The bands act like static support/resistance zones.
Key features that set it apart
- Constant width – No false signals from volatility changes. This makes it better for assets with stable percentage moves.
- Customizable MA type – SMA, EMA, WMA, or HMA. I found EMA works best for faster signals.
- Percentage-based – Not standard deviation. This is crucial for crypto and forex where moves are in percentages, not points.
- Clear visual – The bands are solid and easy to spot on the chart. No clutter.
Best settings with specific recommendations
For day trading on 1H–4H:
- MA length: 20
- MA type: EMA
- Envelope percentage: 2% (tight for range-bound markets)
For swing trading on daily:
- MA length: 50
- MA type: SMA
- Envelope percentage: 5% (captures bigger swings)
For volatile assets like altcoins:
- MA length: 14
- Envelope percentage: 8% (adjust to historical volatility)
Test these on your asset’s historical data. If the price constantly touches the bands, widen it. If it rarely reaches them, tighten it.
How to use it for entries and exits
Trend continuation (my preferred method):
- Wait for price to touch or break the upper band in a strong uptrend.
- Do NOT short. Instead, wait for a pullback to the MA line and go long.
- Exit when price reaches the opposite band or the MA slope flattens.
Mean reversion (higher risk):
- Price touches upper band in a range – sell.
- Price touches lower band – buy.
- Place stop loss just outside the band. Target the middle MA.
No-go zones: If price is chopping between the bands without touching them, ignore this indicator. Use ATR or volume instead.
Honest pros and cons
Pros:
- Simple to set up and understand.
- Works well with trend-following strategies.
- No repainting (unlike some envelope variants).
- Great for setting trailing stop-loss levels.
Cons:
- Fixed percentage means it fails in extreme volatility (crypto crashes, earnings gaps).
- Lags badly if you use a long MA.
- Useless in sideways markets without additional filters.
Who it’s actually for
- Trend traders who need a clean dynamic support/resistance.
- Swing traders on daily or 4H charts.
- Beginners learning how to use bands without overcomplicating things.
Not for scalpers or anyone trading choppy ranges. You’ll get whipsawed.
Better alternatives if they exist
- Bollinger Bands – Better for mean reversion because they adapt to volatility.
- Keltner Channels – Uses ATR, so it’s more robust for volatile assets.
- Donchian Channels – Pure price-based, no MA lag. Better for breakouts.
If you already use Bollinger Bands, you don’t need this. But if you want a simpler, more stable channel, this is your pick.
FAQ addressing real trader questions
Q: Does this repaint?
A: No. The MA and bands are fixed once the bar closes.
Q: Can I use it for crypto?
A: Yes, but widen the percentage. 5-8% on daily works better than 2%.
Q: What’s the best MA type?
A: EMA for speed, SMA for reliability. HMA is overkill.
Q: How do I set the percentage?
A: Look at the asset’s average true range as a percentage of price over the last 100 bars. Use that as your starting point.
Final verdict with star rating
⭐⭐⭐⭐ (4/5)
Moving_Average_Envelope isn’t flashy, but it’s a workhorse. It gives you clean, constant bands that work well with trend-following systems. The fixed percentage is both its strength and weakness. If you know how to set the width and pair it with volume or RSI for confirmation, you’ll get consistent signals. If you just slap it on and hope, you’ll be disappointed.
Bottom line: Install it, tweak the percentage for your asset, and use it as a trailing stop or entry filter. It won’t make you rich alone, but it’s a solid part of a toolkit.
Go Deeper with The Indicator Lab
🔬 The Lab Report — 93 indicators. 20 markets. One consensus verdict every 15 minutes. Stop guessing which indicator to trust.
📈 The Lab Edge — Time-Series Momentum across 166 markets. The same framework institutions use. Weekly signals to your phone.
📊 Prefer to trade on your own? Power your analysis on TradingView — the platform behind every review on this site.
Try TradingView Free → Affiliate link · We earn a commission at no extra cost to you
Data source: TradingView. This review is based on publicly available indicator information and hands-on testing. Always test indicators in a demo environment before live trading.
93 indicators is too many to watch. One is too few to trust.
Moving_Average_Envelope Review: Settings, Strategy & How to Use It is one opinion. The Lab Report gives you the consensus of 93 — delivered to your phone every 15 minutes. No chart clutter required.
Know WHAT to buy. Now know WHEN.
The Lab Edge runs Time-Series Momentum — the same framework institutions use — across 166 markets, 95% profitable in backtesting. One signal. Once a week. No indicators to configure.
🔬 Are you the developer of this indicator? Email us →