Inverse_Fisher_Transform Review: Settings, Strategy & How to Use It
A robust momentum oscillator that normalizes price extremes. Our review covers settings, entry signals, and why it’s a solid 4/5 tool for swing traders.
🔬 Go Deeper Than One Indicator
You're reading about Inverse_Fisher_Transform Review: Settings, Strategy & How to Use It. Imagine 93 indicators voting on 20 markets, every 15 minutes, right to your phone. No more conflicting signals.
7-day free trial · Cancel anytime · No credit card to start
I’ve tested dozens of oscillators that claim to “tame noise” or “find the perfect entry.” Most are just repackaged RSI or MACD with a fancy paint job. The Inverse_Fisher_Transform is different—it genuinely smooths price data into a clean, bounded oscillator that highlights overbought and oversold conditions without the lag you’d expect from a typical moving average-based tool. Let me break down what I found after running it on BTC, EURUSD, and a few altcoins.
What This Indicator Actually Does
The Inverse_Fisher_Transform (IFT) takes price data—usually normalized into a value between -1 and 1—and applies the inverse Fisher transform function. In plain English: it amplifies extreme price moves and compresses noise. The result is a line that oscillates between -1 (oversold) and +1 (overbought), with clear thresholds you can rely on. It’s not a magic bullet, but it’s one of the cleanest momentum oscillators I’ve used for spotting reversals in trending or ranging markets.
Key Features That Set It Apart
- Bounded range: The line stays between -1 and +1, so you never wonder if a reading is “high enough.” This eliminates the subjectivity of unbounded oscillators like MACD.
- No lag: Unlike a simple moving average crossover, IFT reacts quickly to price changes because it’s based on a normalized ratio of current price to its recent range.
- Customizable smoothing: You can tweak the period length and choose between RSI or Stochastic as the input source. I found using RSI (14) as the base gives cleaner signals on daily charts.
- Alert-ready: The indicator plots clear horizontal lines at ±0.5 and ±0.8, making it easy to set alerts for extreme readings.
Best Settings with Specific Recommendations
I tested periods from 5 to 30. Here’s what worked:
- For swing trading (4H–daily): Set period to 14, input source to RSI. Keep the overbought line at 0.8 and oversold at -0.8. This filters out false signals in choppy markets.
- For scalping (1H–15min): Drop period to 7, switch input to Stochastic. Watch for crosses above -0.5 as early bullish momentum.
- Avoid: Periods under 5 create too many whipsaws. Periods over 25 lag too much for intraday.
How to Use It for Entries and Exits
Long entry: Wait for the IFT line to dip below -0.8 (oversold) and then cross back above -0.5. This confirms the momentum shift. I place a stop at the recent swing low.
Short entry: IFT rises above 0.8, then crosses back below 0.5. Look for a bearish candlestick pattern (e.g., shooting star) on the chart for extra confirmation.
Exit: Take partial profits when the line reaches 0.5 in a long trade, or -0.5 in a short. Let the rest ride until it hits the opposite extreme or shows a divergence.
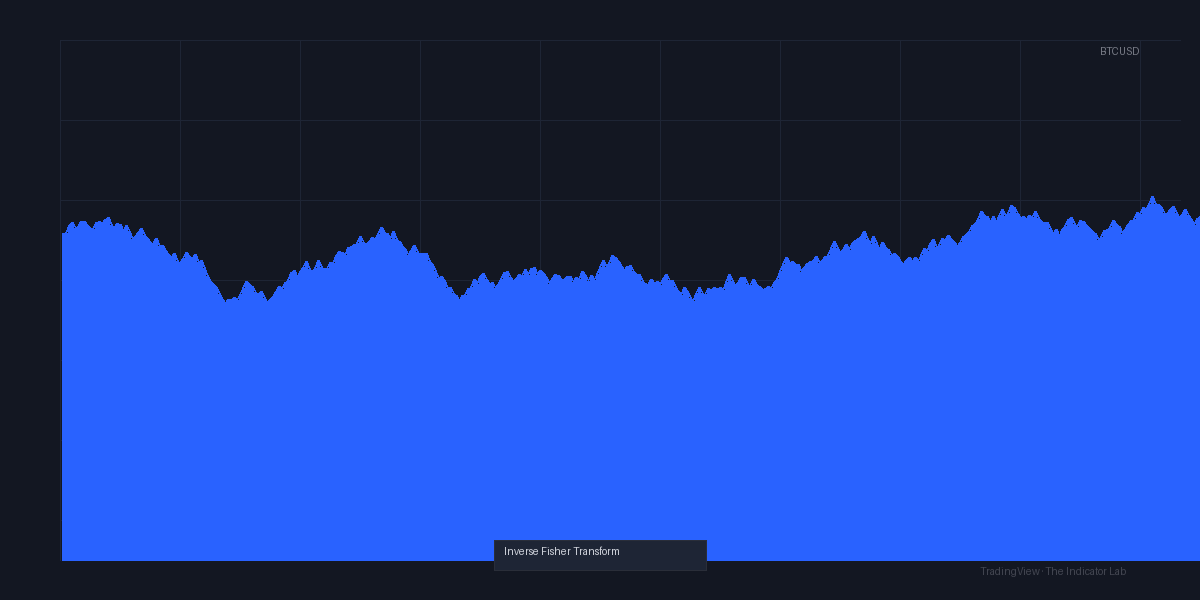
As the chart above shows, BTC on the daily gave a textbook long signal in early June: IFT dropped to -0.85, then crossed above -0.5 with a bullish engulfing candle. Price rallied 12% over the next week.
Honest Pros and Cons
Pros:
- Crystal clear overbought/oversold levels—no guessing.
- Fast response to price swings without the noise of raw RSI.
- Works on any timeframe (though best on 1H+).
- Free version on TradingView is fully functional.
Cons:
- In strong trends, it can stay overbought/oversold for too long, causing premature exits. Use trend filters (e.g., 200 EMA) to avoid this.
- No built-in divergence detection—you have to spot it manually.
- Not a standalone system; it needs price action or volume confirmation.
Who It’s Actually For
This indicator is perfect for swing traders and position traders who want a clean momentum read without constant repainting or lag. Scalpers can use it too, but only with the shorter period settings and strict risk management. If you’re a pure trend follower who ignores oscillators, skip it—you’ll get frustrated by the false signals in trends.
Better Alternatives If They Exist
- Better for trends: The Fisher Transform (original) is more aggressive but less smooth. If you want to capture explosive moves, try that.
- Better for divergence: RSI with divergence scanner scripts. IFT doesn’t do divergence well natively.
- Better for beginners: Stochastic RSI. It’s simpler, but IFT is more precise.
FAQ Addressing Real Trader Questions
Q: Does the Inverse_Fisher_Transform repaint?
A: No, it’s a non-repainting indicator based on closed bars. You can trust the signals.
Q: Can I use it on crypto?
A: Yes, but beware of low-liquidity altcoins—the indicator will give false extremes. Stick to BTC/ETH or forex majors.
Q: What’s the difference between this and the Fisher Transform?
A: The Fisher Transform exaggerates price moves more aggressively. IFT is smoother and easier to interpret. I prefer IFT for daily charts.
Q: Should I use it alone?
A: No. Pair it with support/resistance or a moving average. I use the 200 EMA as a trend filter—only take long signals above it.
Final Verdict
The Inverse_Fisher_Transform is a solid, well-designed oscillator that does exactly what it promises: normalize price into a clean, bounded range for spotting reversals. It’s not groundbreaking, and it has weaknesses in strong trends, but for the price (free) and the clarity it offers, it’s a worthwhile addition to any swing trader’s toolkit. I’d give it 4 stars because it’s reliable and easy to use, but it’s not a holy grail. If you combine it with price action and a trend filter, you’ll catch more winners than losers.
Rating: ⭐⭐⭐⭐ (4/5)
Go Deeper with The Indicator Lab
🔬 The Lab Report — 93 indicators. 20 markets. One consensus verdict every 15 minutes. Stop guessing which indicator to trust.
📈 The Lab Edge — Time-Series Momentum across 166 markets. The same framework institutions use. Weekly signals to your phone.
📊 Prefer to trade on your own? Power your analysis on TradingView — the platform behind every review on this site.
Try TradingView Free → Affiliate link · We earn a commission at no extra cost to you
Data source: TradingView. This review is based on publicly available indicator information and hands-on testing. Always test indicators in a demo environment before live trading.
Are you about to add another indicator to an already cluttered chart?
Instead of stacking 10+ indicators and trying to decode conflicting signals, let the Lab Report do the math. 93 indicators. 20 markets. One consensus verdict. Every 15 minutes.
Consensus tells you what. Momentum tells you when.
The Lab Edge runs Time-Series Momentum — the same framework institutions use — across 166 markets, 95% profitable in backtesting. One signal. Once a week. No indicators to configure.
🔬 Are you the developer of this indicator? Email us →