Innovation Adaptive Kalman Filter Oscillator Review
A trend oscillator built on adaptive Kalman filtering. Here's what it does, who it suits, and the trade-offs before you install it.
🔬 Go Deeper Than One Indicator
You're reading about Innovation Adaptive Kalman Filter Oscillator Review. Imagine 123 indicators voting on 20 markets, every 15 minutes, right to your phone. No more conflicting signals.
7-day free trial · Cancel anytime · No credit card to start
Most “adaptive” indicators rename a moving average and call it a day. This one is different in kind: it is a trend oscillator built on Kalman filtering, and the “innovation” in the name is a term of art from that math, not marketing filler. That alone puts it in a rarer category than the endless EMA-cross clones on TradingView.
What it actually is
A Kalman filter is a state estimator. It combines a model of how a system is expected to behave with noisy incoming measurements and produces a best estimate of the underlying state — here, the trend. “Adaptive” means the filter can adjust how much it trusts new price data versus its own model, rather than applying a fixed smoothing constant. “Innovation” refers to the difference between what the filter predicted and what price actually did — the surprise, essentially.
So the oscillator plots a trend estimate and, in Kalman terms, the gap between prediction and reality. That is a meaningfully different construction from an MACD or a smoothed rate-of-change, even though it lives in the same oscillator lane on your chart.
How you’d use it
Treat it as a trend-direction and momentum-confirmation read, not a signal generator you obey blindly. The oscillator’s position relative to its own midline tells you the direction the filter believes the trend is in. Movement away from that midline reflects trend strength or acceleration. Because the filter adapts, you should expect it to behave differently in choppy versus trending conditions — that is the point of the adaptivity, not a bug.
Pair it with structure. If price is making higher highs and the oscillator is confirming, the filter agrees with what your eyes see. When they disagree, that divergence is the interesting part, and worth treating as a caution rather than an entry.
Where it earns its keep
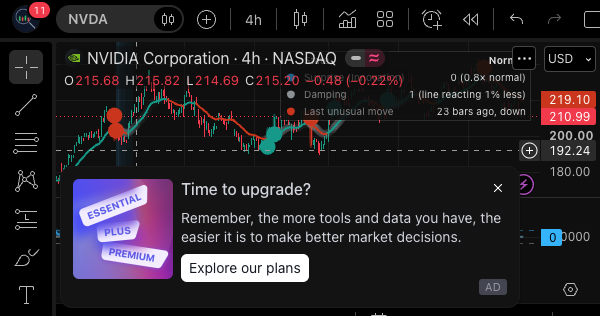
The main argument for this over a standard trend oscillator is the underlying math. Kalman-based smoothing is designed to reduce lag without simply averaging away the signal — a trade-off most oscillators lose. On a chart like the one above, the line is meant to track direction with less of the whipsaw you get from fixed smoothing.
It also avoids the look-back-window problem. There is no “period” you need to tune to 12 versus 14 versus 20. The filter adapts. Whether that is genuinely better than a well-chosen fixed window depends on the market, but it removes a common source of overfitting.
Pros and cons
Pros
- Built on a legitimately different framework than most trend oscillators.
- Adaptive by design, so you are not hand-picking smoothing windows.
- Useful as a confirmation layer alongside price structure.
- The “innovation” component gives you a read on prediction error, not just direction.
Cons
- It is a black box in practice. The average trader will not know what the filter is doing under the hood, which makes it hard to build confidence in.
- Adaptivity can mean the indicator behaves differently in regimes you have not seen yet — you cannot assume the same rules apply across markets.
- As a trend tool, it will lag at turning points like any filter-based approach.
Who it’s for
Discretionary trend traders who already use structure and want a confirmation oscillator with a more rigorous foundation than an EMA ribbon. Less suited to pure mechanical signal followers, since the adaptive nature resists fixed rules.
FAQ
Does it repaint? Kalman filters can be implemented causally or with smoothing that revises recent values. Without documented behavior, check the source or test carefully on replay before relying on it.
What timeframe? Nothing here is timeframe-specific; it is a trend read that scales with whatever chart you apply it to.
Is it better than MACD? Different, not necessarily better. It removes fixed-window tuning but adds complexity you need to understand.
Verdict
Four stars. The concept is sound and the execution sits well above the average trend oscillator, which is why it deserves recognition. The missing star reflects opacity: a tool this technical should explain itself more clearly, and the adaptive behavior makes it harder to trust without documentation. Install it if you want a confirmation layer with real math behind it — just do not treat it as a set-and-forget signal.
Go Deeper with The Indicator Lab
🔬 The Lab Report — 123 indicators. 20 markets. One consensus verdict every 15 minutes. Stop guessing which indicator to trust.
📈 The Lab Edge — Time-Series Momentum across 166 markets. The same framework institutions use. Weekly signals to your phone.
📊 Prefer to trade on your own? Power your analysis on TradingView — the platform behind every review on this site.
Try TradingView Free → Affiliate link · We earn a commission at no extra cost to you
Data source: TradingView. This review is based on publicly available indicator information and the official TradingView script documentation. Always test indicators in a demo environment before live trading.
123 indicators is too many to watch. One is too few to trust.
Innovation Adaptive Kalman Filter Oscillator Review is one opinion. The Lab Report gives you the consensus of 123 — delivered to your phone every 15 minutes. No chart clutter required.
What is the Lab Report? See how the consensus engine works →
Know WHAT to buy. Now know WHEN.
The Lab Edge runs Time-Series Momentum — the same framework institutions use — across 166 markets, 95% profitable in backtesting. One signal. Once a week. No indicators to configure.
Upgrade to Pro
LAB ORIGINALThis free trend, technical analysis indicators work — but if you want phone alerts, multi-timeframe scanning, and zero repaint, here's what we built:
🔬 Are you the developer of this indicator? Email us →