Ichimoku Trend Oscillator Gabremoku Review — Momentum
Ichimoku Trend Oscillator [Gabremoku] review: a momentum read on the Ichimoku system that turns trend strength into an oscillator. Honest take inside.
🔬 Go Deeper Than One Indicator
You're reading about Ichimoku Trend Oscillator Gabremoku Review — Momentum. Imagine 123 indicators voting on 20 markets, every 15 minutes, right to your phone. No more conflicting signals.
7-day free trial · Cancel anytime · No credit card to start
Ichimoku is one of those systems traders either love or bounce off hard. Five lines, a cloud, and a whole vocabulary of Japanese terms tend to bury the one question that actually matters: is the trend strong right now, or is it fading? The Ichimoku Trend Oscillator [Gabremoku] attacks that problem by compressing the Ichimoku framework into an oscillator view. Instead of reading five lines across price, you read one momentum-style panel.
That reframing is the whole point of the indicator, and it’s worth being clear about what it is before going further.
What it actually does
The name is the honest summary. It’s an oscillator built on top of Ichimoku logic — not a reimplementation of the cloud on your price chart, and not a replacement for the classic five-line setup. The oscillator distils the trend information the Ichimoku system already contains into a single fluctuating line (or set of lines) that sits below or above price, in the style of a momentum study.
The practical effect: you stop squinting at whether price is above or below the cloud and start looking at whether trend pressure is building or draining. That’s a different question, and often a more useful one for timing entries within an established move.
One honest caveat up front: no official documentation was available for this review. So I’m describing the concept and its general behaviour, not a verified list of inputs, default values, or calculation internals. If you need exact parameters, read the source on TradingView before relying on it.
Where it fits a workflow
The oscillator is designed to complement Ichimoku, not replace it. The cleanest way to use it is as a confirmation layer on top of a conventional Ichimoku chart:
- The cloud and price position tell you the direction of the trend.
- The oscillator tells you about the strength and momentum behind it.
When those two agree, you have a cleaner case. When they diverge — price holding above the cloud while the oscillator rolls over, for instance — that’s a warning worth respecting. This is the same logic traders apply to MACD or RSI against a trend, just with the Ichimoku inputs doing the work.
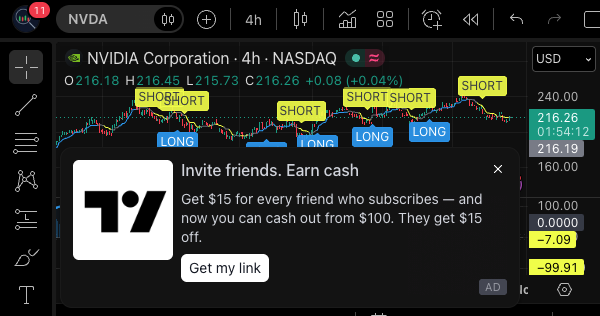
As shown in the chart above, the oscillator reads as a momentum panel beneath price, which makes it easy to run alongside your existing Ichimoku setup without visual clutter.
Pros and cons
Pros
- Turns a crowded system into a clean read. If the Ichimoku cloud has always felt like too much to parse, an oscillator view lowers the barrier considerably.
- Conceptually coherent. It isn’t a random mashup — the trend logic comes from Ichimoku, so it stays consistent with that framework rather than fighting it.
- Good as a filter, not a trigger. Its real value is confirming or questioning a trend read, which is exactly where most trend-following mistakes happen.
- Pairs naturally with the classic setup rather than demanding you abandon it.
Cons
- Oscillators lag by nature. Any momentum read derived from trend structure will confirm moves after they start, not before. Don’t expect it to call tops.
- Thin documentation makes it harder to know exactly what you’re looking at without digging into the source.
- It is not a standalone system. Treating a single oscillator line as a buy/sell signal is how people get chopped up in ranges.
- Overlap with existing tools. If you already run MACD or an Ichimoku-based momentum filter, the marginal value may be smaller than it first appears.
Who it’s for
This is aimed at traders who already respect Ichimoku but want a faster, cleaner trend read — swing and position traders on higher timeframes especially, where trend structure matters more than noise. It’s less useful for pure scalpers, and it’s probably overkill for someone who never got on with Ichimoku in the first place. If you’re a discretionary trend follower who likes confirmation layers, it slots in naturally.
FAQ
Does it replace the Ichimoku cloud? No. It’s an oscillator derived from Ichimoku-style trend logic. You still want the cloud for direction and support/resistance context.
Can I use it on any timeframe? Nothing in the concept restricts it, but oscillators of this type are generally more stable on higher timeframes where trend structure is clearer. Test it on your own charts.
Is it a signal generator? Treat it as a confirmation tool. It tells you about trend strength, not precise entries.
What are the default settings? I can’t verify these without the official documentation — check the indicator’s source page on TradingView before relying on specific values.
Verdict
The Ichimoku Trend Oscillator [Gabremoku] does one thing well: it makes Ichimoku’s trend information readable as momentum. That’s a genuinely useful reframe for anyone who likes the system but finds the cloud unwieldy. It won’t replace your setup and it won’t call turns, but as a confirmation layer on top of a proper Ichimoku chart, it earns its place. The lack of clear documentation and its inherently lagging nature keep it short of top marks.
Rating: ⭐⭐⭐⭐ (4/5) — a solid, coherent tool for Ichimoku users who want a cleaner momentum read.
Go Deeper with The Indicator Lab
🔬 The Lab Report — 123 indicators. 20 markets. One consensus verdict every 15 minutes. Stop guessing which indicator to trust.
📈 The Lab Edge — Time-Series Momentum across 166 markets. The same framework institutions use. Weekly signals to your phone.
📊 Prefer to trade on your own? Power your analysis on TradingView — the platform behind every review on this site.
Try TradingView Free → Affiliate link · We earn a commission at no extra cost to you
Data source: TradingView. This review is based on publicly available indicator information and the official TradingView script documentation. Always test indicators in a demo environment before live trading.
123 indicators is too many to watch. One is too few to trust.
Ichimoku Trend Oscillator Gabremoku Review — Momentum is one opinion. The Lab Report gives you the consensus of 123 — delivered to your phone every 15 minutes. No chart clutter required.
What is the Lab Report? See how the consensus engine works →
Know WHAT to buy. Now know WHEN.
The Lab Edge runs Time-Series Momentum — the same framework institutions use — across 166 markets, 95% profitable in backtesting. One signal. Once a week. No indicators to configure.
Upgrade to Pro
LAB ORIGINALThis free trend, technical analysis indicators work — but if you want phone alerts, multi-timeframe scanning, and zero repaint, here's what we built:
🔬 Are you the developer of this indicator? Email us →