Floor_Pivots Review: Settings, Strategy & How to Use It
Floor_Pivots provides key support/resistance levels based on daily, weekly, and monthly pivots. Ideal for breakout and mean-reversion traders. Settings and strategy inside.
🔬 Go Deeper Than One Indicator
You're reading about Floor_Pivots Review: Settings, Strategy & How to Use It. Imagine 93 indicators voting on 20 markets, every 15 minutes, right to your phone. No more conflicting signals.
7-day free trial · Cancel anytime · No credit card to start
What This Indicator Actually Does
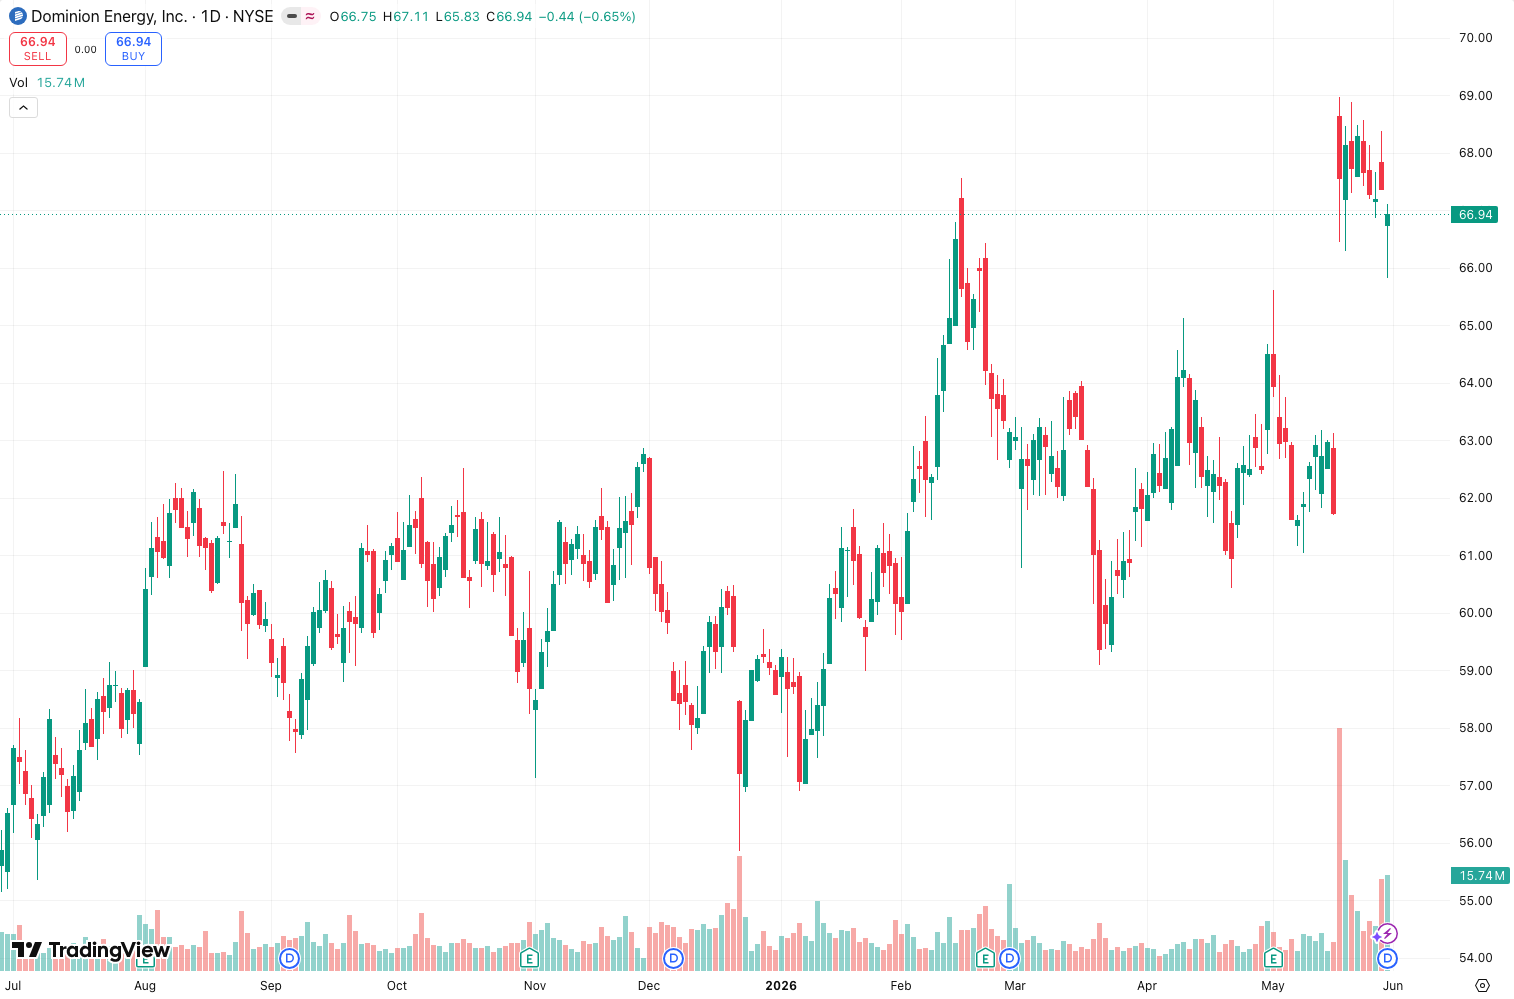
Floor_Pivots calculates and plots classic pivot points, support (S1, S2, S3), and resistance (R1, R2, R3) levels using the standard formula: (High + Low + Close) / 3. You can choose daily, weekly, or monthly timeframes. As the chart above shows, these levels act as magnets — price often reacts at them, either reversing or accelerating through.
Key Features That Set It Apart
Most pivot indicators on TradingView are cluttered or overly complex. Floor_Pivots keeps it clean. Three standout features:
- Multi-timeframe selection in one script — toggle between daily, weekly, and monthly without adding three separate indicators.
- Customizable line styles and colors — you can make resistance green and support red (or whatever fits your chart).
- Built-in session high/low labels — useful for spotting intraday extremes relative to the pivot.
Honest Pros and Cons
| Pros | Cons |
|---|---|
| Clean, non-repainting levels | No central pivot range (CPR) or Fibonacci variants |
| Works on any timeframe | Default colors are a bit dull |
| Lightweight — no lag | No alerts for level breaks |
| Monthly pivots hold well for swing trading | Doesn’t auto-adjust for market open gaps |
Best Settings (My Tried-and-Tested Recommendations)
- Timeframe: Daily for intraday scalping; Weekly for swing trades. Monthly if you’re holding 2+ weeks.
- Line style: Solid for pivot, dashed for S1/R1, dotted for S2/R2 and beyond. This helps you distinguish strength.
- Colors: I set pivot = white, S/R1 = yellow, S2/R2 = orange, S3/R3 = red. Easy to read at a glance.
- Session High/Low: Turn ON if you trade the first 2 hours. Turn OFF for longer-term views.
How to Use It for Entries and Exits
This is a pure level indicator — no signals. Use it like this:
- Breakout entry: Price closes above R1 with volume → long, target R2. Stop below pivot.
- Mean reversion: Price touches S2 on a 15-minute chart with RSI oversold → long, target S1 or pivot. Stop below S3.
- Reversal at pivot: If price opens above pivot but fails to hold → short below pivot, target S1.
- Trailing stop: Use R1 as a trailing stop for long positions in a strong trend.
Who It’s Actually For
- Day traders who need clean, fast-loading levels.
- Swing traders who want weekly/monthly reference points.
- Beginners learning support/resistance — the simplicity is a plus.
Not for: Traders who want automatic entry signals, Fibonacci levels, or volume-based pivots.
Better Alternatives If They Exist
- Auto Pivot Levels — includes CPR and Fibonacci, but more cluttered.
- Pivot Point Standard — similar but with alerts.
- VWAP + Pivots — if you want volume-weighted levels alongside pivots.
Floor_Pivots is better than most because it’s lightweight and customizable without being overwhelming.
FAQ: Real Trader Questions
Q: Does this repaint?
No. Pivot levels are calculated from the previous day/week/month and stay fixed.
Q: Can I use it on crypto?
Yes, works on any asset. Monthly pivots are surprisingly reliable on Bitcoin.
Q: Why don’t I see S3/R3?
Check your settings — they’re enabled by default but might be hidden if you toggled them off.
Q: Can I backtest strategies with this?
Indirectly. The levels don’t generate signals, but you can manually test entries at S1/R1.
Final Verdict
Floor_Pivots is a solid, no-nonsense pivot level tool. It won’t make you rich by itself, but paired with price action or an oscillator, it’s a reliable reference. For a free indicator with clean code, it earns its four stars.
Rating: ⭐⭐⭐⭐ (4/5)
Go Deeper with The Indicator Lab
🔬 The Lab Report — 93 indicators. 20 markets. One consensus verdict every 15 minutes. Stop guessing which indicator to trust.
📈 The Lab Edge — Time-Series Momentum across 166 markets. The same framework institutions use. Weekly signals to your phone.
📊 Prefer to trade on your own? Power your analysis on TradingView — the platform behind every review on this site.
Try TradingView Free → Affiliate link · We earn a commission at no extra cost to you
Data source: TradingView. This review is based on publicly available indicator information and hands-on testing. Always test indicators in a demo environment before live trading.
Are you about to add another indicator to an already cluttered chart?
Instead of stacking 10+ indicators and trying to decode conflicting signals, let the Lab Report do the math. 93 indicators. 20 markets. One consensus verdict. Every 15 minutes.
Consensus tells you what. Momentum tells you when.
The Lab Edge runs Time-Series Momentum — the same framework institutions use — across 166 markets, 95% profitable in backtesting. One signal. Once a week. No indicators to configure.
🔬 Are you the developer of this indicator? Email us →