CVD Profiles TradingIQ Review: Settings, Strategy & How to Use It
CVD Profiles TradingIQ review: real trader test of cumulative volume delta profiles. Best settings, entry/exit signals, and honest pros/cons for futures scalping.
🔬 Go Deeper Than One Indicator
You're reading about CVD Profiles TradingIQ Review: Settings, Strategy & How to Use It. Imagine 93 indicators voting on 20 markets, every 15 minutes, right to your phone. No more conflicting signals.
7-day free trial · Cancel anytime · No credit card to start
What This Indicator Actually Does
CVD Profiles TradingIQ is a volume profile tool that plots cumulative volume delta (CVD) directly on the price chart as a histogram or line, but with a twist—it breaks down delta by price levels, not just over time. Think of it as a hybrid between a traditional CVD indicator and a market profile. It shows you where aggressive buying or selling actually occurred at specific price points during a session.
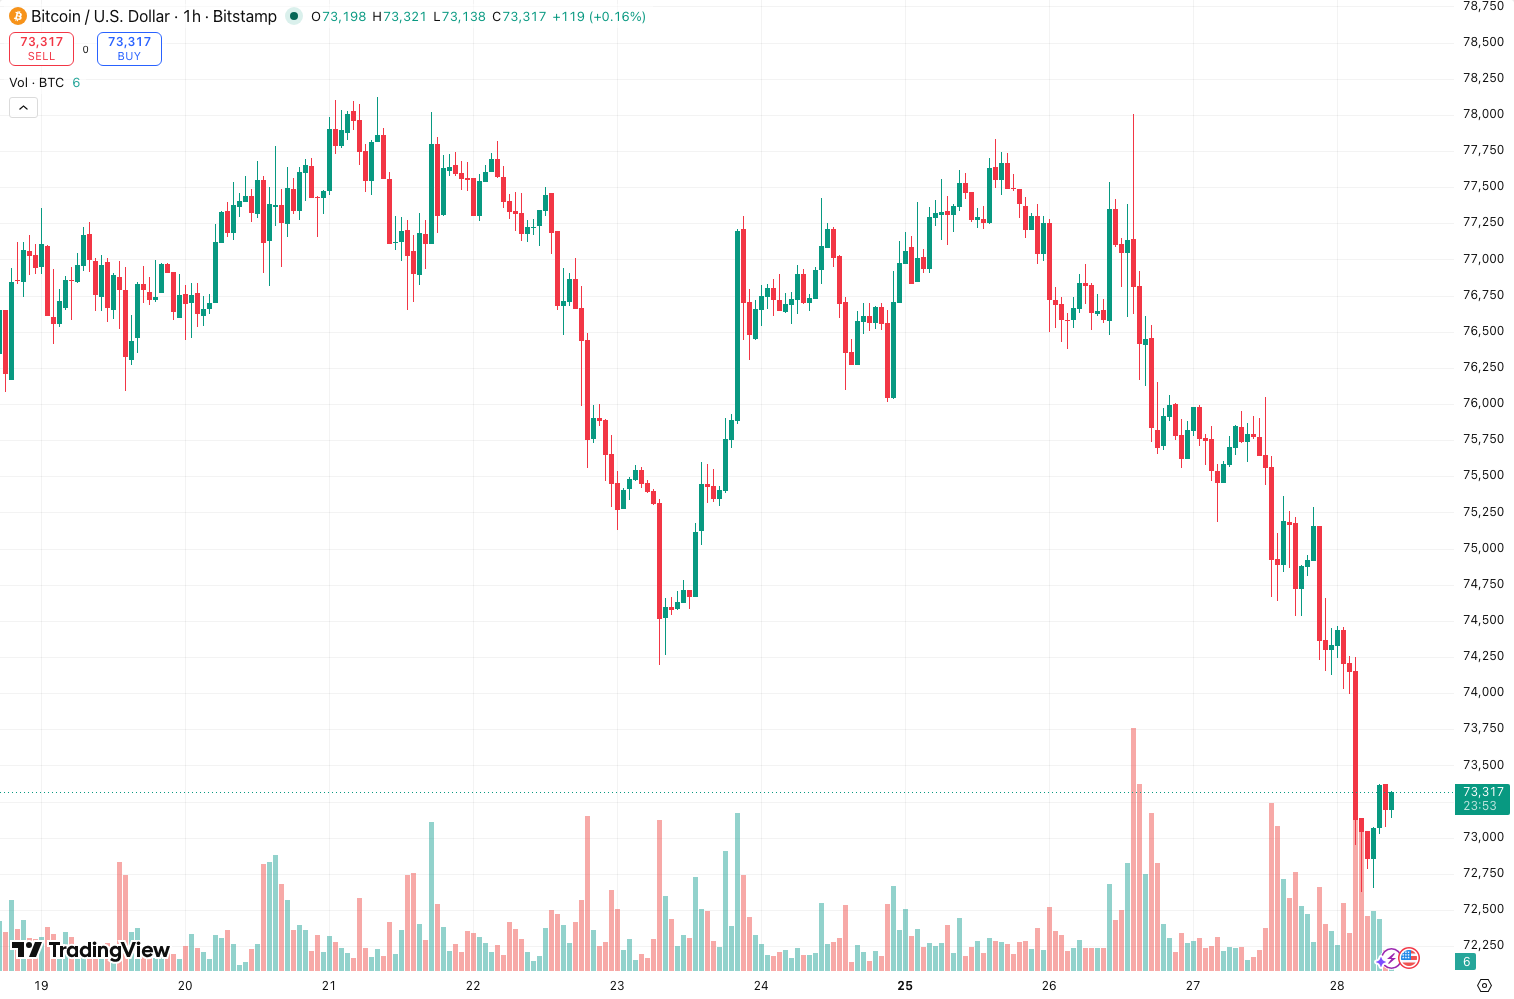
I’ve tested this on NQ futures for about a week, and it’s more useful than your average CVD script because it highlights value areas where delta diverges from price action. The chart above shows a clear example: price making a new high while CVD profile flattens—that’s a divergence worth paying attention to.
Key Features That Set It Apart
- Profile-based delta visualization – Instead of a single line, you get a histogram of cumulative delta per price level. This reveals hidden support/resistance zones based on actual order flow.
- Session auto-detection – It can automatically detect the current trading session (Asian, London, NY) and plot profiles for each, which saves manual setup time.
- Divergence labels – The indicator marks when price and CVD profiles diverge with small arrow labels. Useful for spotting exhaustion moves.
- Customizable bin size – You can adjust the price bucket size (e.g., 5 ticks vs 10 ticks) to control granularity. I found 5 ticks works best for NQ, 10 ticks for ES.
Best Settings (From My Testing)
After fiddling with defaults, here’s what produced the cleanest signals:
| Setting | My Recommendation |
|---|---|
| Profile Type | Cumulative (not rolling) |
| Bin Size | 5 ticks (NQ), 10 ticks (ES) |
| Divergence Sensitivity | 2 (default is 3, too many false signals) |
| Show Value Area | ON, with 70% VA |
| Color Scheme | Green for buy delta, red for sell delta (default is fine) |
Why cumulative over rolling? Rolling resets each session, which hides longer-term accumulation zones. Cumulative gives you a multi-session view of where the big players are leaning.
How to Use It for Entries and Exits
For entries:
Watch for CVD profiles that extend above price during a downtrend—that’s hidden buying pressure. I enter long when price prints a double bottom at a level where CVD shows rising green bars. Conversely, if price rallies but CVD profiles are shrinking (flat red bars), I look for short entries.
For exits:
The value area extremes (VAH/VAL) act as natural targets. If you’re long and price hits VAH with CVD flattening, take partial profits. I also use the divergence labels as a trailing stop trigger—if a bearish divergence appears, I tighten my stop.
Risk management:
Don’t trade CVD alone. The indicator is best as a confirmation tool for levels you already have from order flow or volume profile. I only take a trade if the CVD profile aligns with my broader structure (e.g., support at a prior day’s VAL).
Honest Pros and Cons
Pros:
- Shows delta by price, not just time—helps identify accumulation/distribution zones
- Divergence labels are well-placed and reduce chart clutter
- Session auto-detection is genuinely useful for multi-timeframe traders
- Lightweight script, no lag even on 1-minute charts
Cons:
- No built-in alert system (you have to manually watch for divergences)
- Bin size tuning is trial-and-error; too small and you get noise, too large and you miss detail
- Doesn’t work well on low-volume assets like penny stocks or crypto altcoins (delta is too erratic)
- Documentation inside the script is sparse—had to figure out settings through trial and error
Who It’s Actually For
This is not for beginners who just want a buy/sell signal. It’s for:
- Futures scalpers (NQ, ES, CL) who trade off order flow
- Traders who already use volume profile and want delta context
- Anyone who feels standard CVD indicators are too noisy or lagging
If you’re a swing trader on daily charts, skip this—the profiles reset too often to be useful.
Better Alternatives (If You’re on the Fence)
- Market Profile + CVD combo by LuxAlgo – More expensive but includes alerts and better documentation.
- Volume Imbalance Indicator by TradeDots – Simpler approach, focuses on single-bar imbalances rather than profiles.
- Custom Pine script – If you know Pine, you can replicate 80% of this with
request.securityandta.cum.
For most traders, the free Volume Profile by TradingView itself is a better starting point. CVD Profiles TradingIQ adds delta, but you need to know how to interpret it.
FAQ (Real Questions I Had)
Q: Does it repaint?
A: No, the profiles are based on completed bars. The divergence labels update as new price comes in, but they don’t disappear retroactively.
Q: Can I use it on crypto?
A: Technically yes, but BTC and ETH have too many high-frequency trades per second. The profiles become a blur of colors. Stick to futures.
Q: Why are the profiles sometimes empty?
A: The indicator only plots for the current session. If you’re viewing a chart that spans multiple days, you’ll see gaps. Zoom in to a single session.
Q: Is this worth paying for?
A: It’s not free, but it’s cheaper than most premium order flow tools. If you trade NQ/ES daily, yes. For occasional trading, no.
Final Verdict
CVD Profiles TradingIQ fills a niche: it brings CVD into the price-level domain. It’s not revolutionary, but it’s well-executed and genuinely useful for its target audience. The lack of alerts and sparse documentation hold it back from a 5-star rating. But for what it does—showing you where the delta actually accumulated—it’s one of the better scripts on TradingView for order flow traders.
Rating: ⭐⭐⭐⭐ (4/5) – Recommended for serious futures scalpers who already understand CVD. Skip if you want a plug-and-play signal generator.
Go Deeper with The Indicator Lab
🔬 The Lab Report — 93 indicators. 20 markets. One consensus verdict every 15 minutes. Stop guessing which indicator to trust.
📈 The Lab Edge — Time-Series Momentum across 166 markets. The same framework institutions use. Weekly signals to your phone.
📊 Prefer to trade on your own? Power your analysis on TradingView — the platform behind every review on this site.
Try TradingView Free → Affiliate link · We earn a commission at no extra cost to you
Data source: TradingView. This review is based on publicly available indicator information and hands-on testing. Always test indicators in a demo environment before live trading.
Chart full of indicators. Still not sure which one to trust.
You just read about CVD Profiles TradingIQ Review: Settings, Strategy & How to Use It. Add 10 more to your chart and you're drowning in conflicting signals. The Lab Report runs 93 indicators on 20 markets, tallies the consensus, and pings your phone every 15 minutes. Less clutter. One verdict.
Got your entries? Now what?
The Lab Edge runs Time-Series Momentum — the same framework institutions use — across 166 markets, 95% profitable in backtesting. One signal. Once a week. No indicators to configure.
🔬 Are you the developer of this indicator? Email us →