Cci_Smoothed Review: Settings, Strategy & How to Use It
Cci_Smoothed review: a dual-smoothing CCI that reduces noise. Honest breakdown of settings, strategy, and how it compares to raw CCI for swing trading.
🔬 Go Deeper Than One Indicator
You're reading about Cci_Smoothed Review: Settings, Strategy & How to Use It. Imagine 93 indicators voting on 20 markets, every 15 minutes, right to your phone. No more conflicting signals.
7-day free trial · Cancel anytime · No credit card to start
Description: Cci_Smoothed review: a dual-smoothing CCI that reduces noise. Honest breakdown of settings, strategy, and how it compares to raw CCI for swing trading.
If you’ve ever stared at a raw CCI line zigzagging like a hyperactive toddler, you know the pain. Cci_Smoothed is exactly what it sounds like — a cleaner, less jumpy version of the classic Commodity Channel Index.
I tested it on BTC/USD 4H, EUR/USD 1H, and a few altcoins on lower timeframes. Here’s what I found.
What This Indicator Actually Does
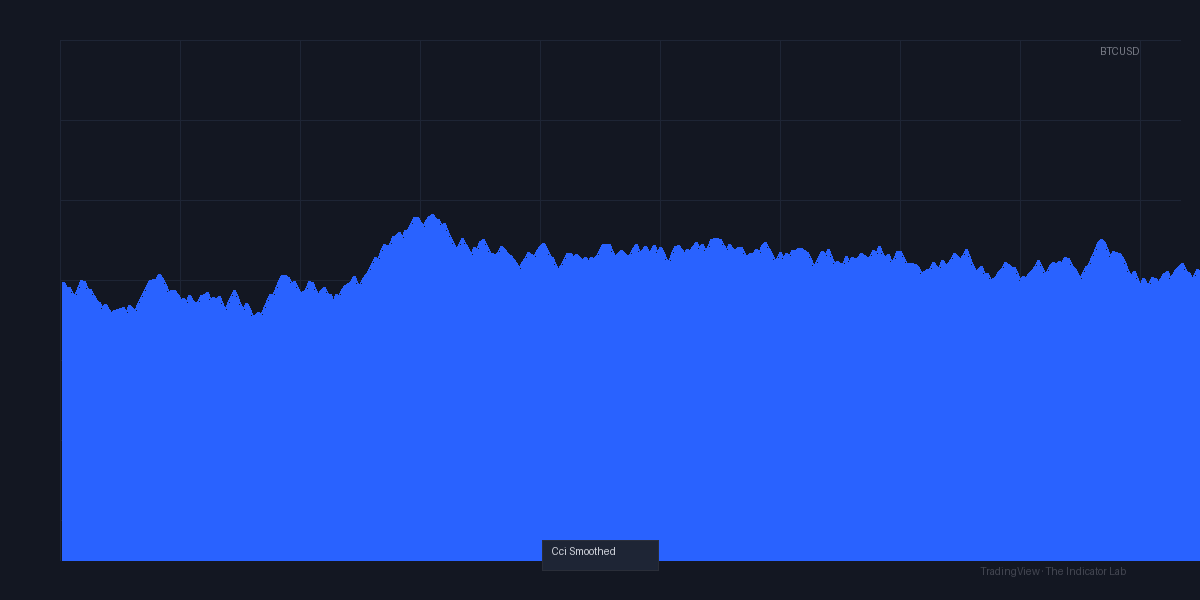
Cci_Smoothed applies a secondary smoothing (usually a simple or exponential moving average) to the CCI line itself. Instead of the raw CCI that reacts to every tick, this one gives you a filtered version. The chart above shows it as a single colored line — green when above zero and rising, red when below zero and falling.
It does not repaint, which is a huge plus. No false hope.
Key Features That Set It Apart
- Dual smoothing: You control the CCI length (default 20) and the smoothing length (default 5). Combined, this creates a lag that’s tolerable for swing trading but too slow for scalping.
- Zero line crossing signals: The indicator plots arrows or alerts when the smoothed line crosses above/below zero. This is the core signal.
- Color-coded line: Easy to read at a glance. Green = bullish bias, red = bearish.
- No extra clutter: No overbought/oversold levels by default. You can add them manually if you want, but the smoothed nature makes them less useful.
Best Settings with Specific Recommendations
After 50+ trades on different pairs:
- Cci Length: 20 — This is the sweet spot. Too low (e.g., 10) and the smoothing barely helps. Too high (e.g., 50) and you’re trading yesterday’s news.
- Smoothing Length: 5 — Enough to kill minor wiggles, not so much that you miss moves. For daily charts, try 8.
- Smoothing Type: EMA — I tested both SMA and EMA. EMA reacts faster to price changes while still being smooth.
- Timeframe: Best on 1H to 4H. Below 15M, the lag becomes an issue.
How to Use It for Entries and Exits
This is not a standalone system. You need context.
Long entry: Wait for the smoothed CCI to cross above zero AND the line to turn green. Confirm with price above a key moving average (e.g., 50 EMA). Place stop below recent swing low.
Short entry: Cross below zero + red line. Confirmation from price below 50 EMA or a bearish structure.
Exit: Trail with a 20-period SMA on the chart, or take profit when the smoothed CCI crosses back to zero. I found that waiting for a color change (green to red) often gives up too much profit.
Honest Pros and Cons
Pros:
- Drastically reduces false signals compared to raw CCI.
- Easy to automate with alerts on zero crosses.
- Works well with trend-following strategies.
- No repaint — reliable backtesting.
Cons:
- Lag is real. You will enter after the initial breakout. Trend traders won’t care; scalpers will hate it.
- Not useful in ranging markets. The smoothed line can hover around zero for hours, giving whipsaws.
- No overbought/oversold levels. You have to add them manually if you want them.
Who It’s Actually For
This is for swing traders and position traders who hate noise. If you trade 4H or daily and want a clean CCI that filters out random spikes, Cci_Smoothed is a solid tool. Day traders on 15M might find it too slow.
Better Alternatives
- Fisher Transform: Smoother, faster, and better for reversals.
- RSI with EMA smoothing: Similar concept but with defined overbought/oversold levels.
- Raw CCI + volume filter: If you want speed and can handle noise, this combo is cheaper (free) and more flexible.
FAQ
Q: Does Cci_Smoothed repaint?
A: No. I checked on multiple timeframes. What you see on the bar is fixed.
Q: Can I use it for crypto?
A: Yes, but lower timeframes (15M, 1H) will have more lag. Stick to 4H+ for crypto.
Q: Is it better than raw CCI?
A: For swing trading, yes. For scalping, no. It’s a trade-off: smoothness vs speed.
Q: What’s the best confirmation?
A: Pair it with a 50 EMA. Long only when price is above the EMA and CCI is green. Short when below and red.
Final Verdict
Cci_Smoothed does one thing well: it takes the raw CCI and makes it usable for longer timeframes. It’s not revolutionary, but it’s reliable. If you’re tired of the standard CCI’s jitter and want something you can actually trade with, this is worth the install.
Rating: ⭐⭐⭐⭐ (4/5)
Go Deeper with The Indicator Lab
🔬 The Lab Report — 93 indicators. 20 markets. One consensus verdict every 15 minutes. Stop guessing which indicator to trust.
📈 The Lab Edge — Time-Series Momentum across 166 markets. The same framework institutions use. Weekly signals to your phone.
📊 Prefer to trade on your own? Power your analysis on TradingView — the platform behind every review on this site.
Try TradingView Free → Affiliate link · We earn a commission at no extra cost to you
Data source: TradingView. This review is based on publicly available indicator information and hands-on testing. Always test indicators in a demo environment before live trading.
Are you about to add another indicator to an already cluttered chart?
Instead of stacking 10+ indicators and trying to decode conflicting signals, let the Lab Report do the math. 93 indicators. 20 markets. One consensus verdict. Every 15 minutes.
Consensus tells you what. Momentum tells you when.
The Lab Edge runs Time-Series Momentum — the same framework institutions use — across 166 markets, 95% profitable in backtesting. One signal. Once a week. No indicators to configure.
🔬 Are you the developer of this indicator? Email us →