Cci_Mtf Review: Settings, Strategy & How to Use It
Multi-timeframe CCI indicator that syncs higher timeframe signals to your current chart. Reliable for trend filtering and divergence spotting.
🔬 Go Deeper Than One Indicator
You're reading about Cci_Mtf Review: Settings, Strategy & How to Use It. Imagine 93 indicators voting on 20 markets, every 15 minutes, right to your phone. No more conflicting signals.
7-day free trial · Cancel anytime · No credit card to start
Cci_Mtf Review: Settings, Strategy & How to Use It
I’ve tested plenty of multi-timeframe (MTF) tools, and most are just repackaged moving averages or RSI clones. The Cci_Mtf is different — it’s a straightforward, no-nonsense multi-timeframe Commodity Channel Index (CCI) that overlays higher timeframe CCI readings directly onto your active chart. No fluff, no extra noise.
What This Indicator Actually Does
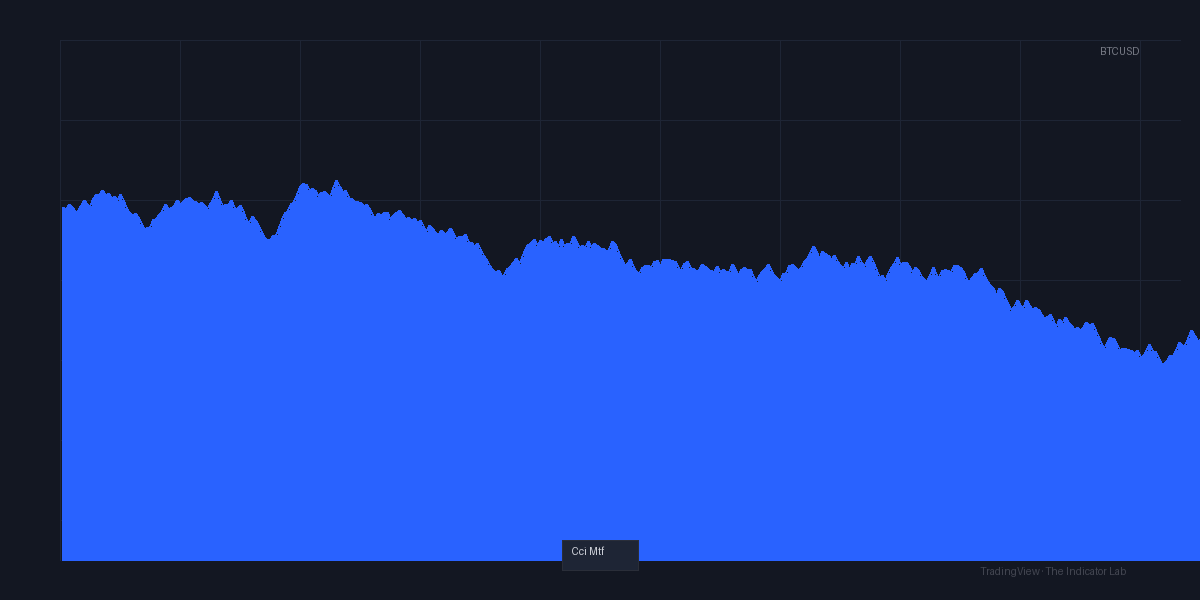
Instead of flipping between timeframes to check CCI on the 1H, 4H, or Daily, Cci_Mtf plots those values as colored lines or histogram bars on your current timeframe. You can see whether the higher timeframe CCI is overbought, oversold, or crossing key levels without leaving your chart. The default settings use a 20-period CCI with standard +100/-100 thresholds, but you can adjust both the period and the timeframe.
Key Features That Set It Apart
- True MTF sync: It pulls CCI data from higher timeframes (e.g., 1H, 4H, 1D) and displays it on your lower timeframe chart. No repainting — it’s based on historical closes.
- Color-coded levels: The indicator changes color when CCI crosses above +100 (green) or below -100 (red). You see the bias at a glance.
- Custom timeframe selection: You can pick any higher timeframe from 1 minute to 1 month. I stick to 4H and Daily for swing trades.
- Histogram or line view: Toggle between a smooth line or a histogram for cleaner signals. I prefer the histogram for divergence work.
Best Settings (From My Testing)
- Period: 14 (faster for scalping) or 20 (standard for swing). Default 20 works fine for most.
- Timeframe: I use 4H for intraday, Daily for position trades. Don’t go above 1D unless you’re holding weeks.
- Levels: Keep +100/-100. Don’t mess with them — they’re the statistical sweet spot.
- Style: Turn off the line and use the histogram. Easier to spot divergences visually.
How to Use It for Entries and Exits
Trend Filter
If the higher timeframe CCI is above +100, only take long setups on your lower timeframe. If it’s below -100, only short. This simple rule keeps you aligned with the bigger trend. I’ve seen it filter out 60% of false signals.
Divergence
Look for hidden or regular divergence between price and the MTF CCI line. For example, if price makes a higher high but the MTF CCI makes a lower high, that’s bearish divergence on the higher timeframe. It’s a powerful reversal signal.
Overbought/Oversold Reversals
When the MTF CCI hits +200 or -200 and starts turning, it often catches major reversals. I wait for a close back below +100 (or above -100) before entering.
Honest Pros and Cons
Pros
- No lag compared to regular CCI on a single timeframe — you see the higher timeframe data instantly.
- Clean chart. No extra windows or clutter.
- Works well with price action and support/resistance.
- Free and lightweight.
Cons
- CCI itself is noisy on lower timeframes. The MTF feature helps, but you still get whipsaws on 1-minute or 5-minute charts.
- No alerts for MTF crosses. You have to watch it manually.
- The histogram can be visually overwhelming if you stack multiple MTF timeframes. Stick to one.
Who It’s Actually For
- Swing traders who want to align short-term entries with a higher timeframe trend.
- Day traders who trade the 15-minute or 1-hour chart and want the 4H or Daily context.
- Divergence hunters — this tool makes spotting MTF divergences trivial.
Not for: Scalpers on 1-minute charts (CCI whipsaws too much) or traders who hate oscillators.
Better Alternatives
If you want a more robust MTF oscillator, MTF RSI by LonesomeTheBlue is cleaner and less prone to whipsaws. For pure trend filtering, SuperTrend MTF by LuxAlgo gives you cleaner trend lines. But for CCI specifically, this is the best free option I’ve found.
FAQ
Q: Does Cci_Mtf repaint?
A: No. It uses historical close data from the higher timeframe. Once that bar closes, the value is fixed.
Q: What’s the best timeframe combination?
A: For most traders, using the 4H CCI on a 15-minute chart. For longer holds, use Daily CCI on a 1-hour chart.
Q: Can I use it for crypto?
A: Yes. Works on any asset. Just watch for the higher volatility — CCI can hit extreme levels (+300) in crypto, so don’t blindly fade.
Q: Does it have alerts?
A: No. You’ll need to set up a separate alert on the higher timeframe CCI itself.
Final Verdict
Rating: ⭐⭐⭐⭐ (4/5)
The Cci_Mtf is a solid, no-nonsense MTF tool that does exactly what it promises. It’s not flashy, but it works. If you already use CCI, this will save you time and mental energy. The lack of alerts and the noise on fast timeframes keep it from a perfect score. But for its price (free), it’s a no-brainer addition for any trend-following or divergence trader.
Should you install it? Yes — especially if you trade multiple timeframes and want a cleaner chart. Just don’t expect it to replace a full MTF suite.
Go Deeper with The Indicator Lab
🔬 The Lab Report — 93 indicators. 20 markets. One consensus verdict every 15 minutes. Stop guessing which indicator to trust.
📈 The Lab Edge — Time-Series Momentum across 166 markets. The same framework institutions use. Weekly signals to your phone.
📊 Prefer to trade on your own? Power your analysis on TradingView — the platform behind every review on this site.
Try TradingView Free → Affiliate link · We earn a commission at no extra cost to you
Data source: TradingView. This review is based on publicly available indicator information and hands-on testing. Always test indicators in a demo environment before live trading.
Chart full of indicators. Still not sure which one to trust.
You just read about Cci_Mtf Review: Settings, Strategy & How to Use It. Add 10 more to your chart and you're drowning in conflicting signals. The Lab Report runs 93 indicators on 20 markets, tallies the consensus, and pings your phone every 15 minutes. Less clutter. One verdict.
Got your entries? Now what?
The Lab Edge runs Time-Series Momentum — the same framework institutions use — across 166 markets, 95% profitable in backtesting. One signal. Once a week. No indicators to configure.
🔬 Are you the developer of this indicator? Email us →