Anchored Vwap Review: Settings, Strategy & How to Use It
Honest Anchored VWAP review: key settings, entry/exit tips, and who it's really for. No fluff, just actionable trader insights.
🔬 Go Deeper Than One Indicator
You're reading about Anchored Vwap Review: Settings, Strategy & How to Use It. Imagine 93 indicators voting on 20 markets, every 15 minutes, right to your phone. No more conflicting signals.
7-day free trial · Cancel anytime · No credit card to start
Final Verdict: ⭐⭐⭐⭐ (4/5) — A solid tool for swing traders and event-driven setups, but don’t expect magic.
What This Indicator Actually Does
The Anchored VWAP is a volume-weighted average price calculation that starts from a manually selected date or bar. Unlike the standard VWAP (which resets daily), this one lets you anchor to any point — an earnings gap, a major news event, a swing low, or the start of a trend. It then plots the VWAP line, standard deviation bands, and sometimes a moving average of VWAP.
I tested this on daily SPY, hourly NVDA, and 15-minute ES futures. The core idea is sound: price tends to revert to the anchored VWAP over time, and the bands act as dynamic support/resistance.
Key Features That Set It Apart
- Multi-anchor support: You can plot multiple anchored VWAPs on the same chart — one for each major event. This is useful for seeing how price reacts to different timeframes.
- Customizable deviation bands: Standard deviations (usually 1, 2, and 3) are the default. You can adjust the multiplier and even choose between sample vs. population standard deviation.
- Source selection: Most versions let you choose HLC3, OHLC4, or just close. I find HLC3 works best for intraday.
- Anchor persistence: The indicator stays anchored even if you scroll the chart. No accidental resets.
Best Settings with Specific Recommendations
For daily swing trading (my main use):
- Anchor: Start of a significant trend or gap (e.g., the day after a Fed meeting)
- Source: HLC3
- Standard deviations: 1 (solid), 2 (outer support/resistance), 3 (extremes)
- Band style: Fill between bands for visual clarity
For intraday futures:
- Anchor: Session open or a news release time
- Source: Close (cleaner lines)
- Standard deviations: 2 and 3 only (1 is too tight)
- Color: I turn off the fill to reduce clutter
How to Use It for Entries and Exits
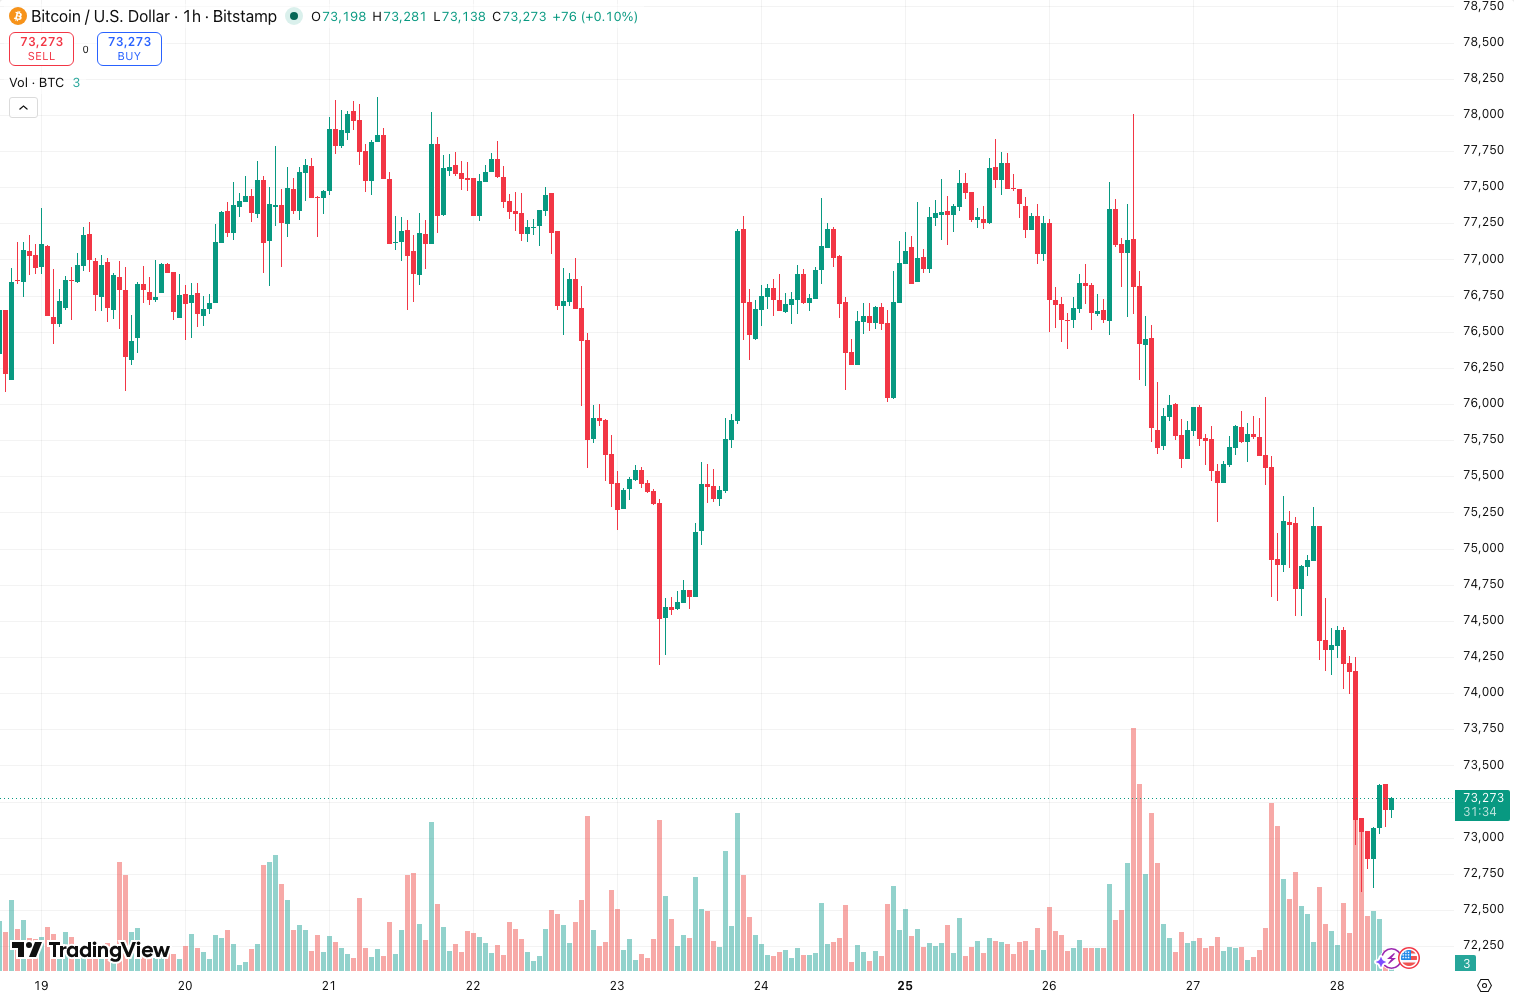
The setup: I look for price to touch the upper or lower 2nd deviation band after a strong move. As the chart above shows, price often snaps back to the VWAP line within 1-3 bars.
Entry:
- Long: Price touches lower 2nd band with a bullish divergence on RSI or MACD. Enter on a confirmed close above the band.
- Short: Price touches upper 2nd band with bearish divergence. Enter on a close below the band.
Exit:
- First target: The VWAP line itself (usually 50% of the move back)
- Second target: The opposite 1st deviation band
- Stop: Close beyond the 3rd deviation band (that’s abnormal volume)
Caveat: Trend days can blow through bands. In strong trends, price can ride the 2nd band for hours. Wait for a pullback or a clean rejection candle.
Honest Pros and Cons
Pros:
- Gives context to price — it’s not just “support” but volume-weighted support
- Works across timeframes (daily to 1-minute)
- Excellent for event-driven trading (earnings, data releases)
- Free on TradingView (built-in version is solid)
Cons:
- Laggy on trend days — you’ll get faked out if you blindly fade bands
- Requires manual anchor selection — no automatic anchoring to highs/lows
- Not great for scalping (the VWAP line is too slow)
- Standard deviation assumption: price doesn’t always respect Gaussian distribution
Who It’s Actually For
- Swing traders holding 1-10 days who want to identify mean reversion zones
- Event traders who anchor to specific news moments
- Position traders who want a long-term reference point (anchor to a major low or high)
- NOT for scalpers or high-frequency traders — you’ll get whipsawed
Better Alternatives If They Exist
- Standard VWAP + Bollinger Bands: If you want a similar concept without manual anchoring, this combo is less work.
- Keltner Channels with volume weighting: Less common but more robust for trend days.
- Volume Profile (Visible Range): Gives you high-volume nodes, which are more precise than VWAP bands.
- Auto-anchored VWAP scripts: Some community scripts automatically anchor to the most recent swing high/low. Search “Auto Anchored VWAP” on TradingView.
FAQ Addressing Real Trader Questions
Q: Does it repaint?
A: No — the anchored VWAP is fixed once you set the anchor. It won’t change historical values.
Q: Should I use it alone?
A: No. Pair it with price action (candlestick patterns, support/resistance) or a momentum oscillator (RSI, MACD) to avoid false signals.
Q: Best timeframe?
A: Daily for swing trades. 1-hour or 15-minute for intraday. Avoid 1-minute — too noisy.
Q: Can I anchor to a specific price level instead of a date?
A: Most TradingView versions only anchor to a bar (date/time). For price-level anchoring, you’ll need a custom script.
Q: How many anchors should I use?
A: One or two max. More than that, and the chart becomes a spaghetti mess.
Final Thoughts
The Anchored VWAP is a solid addition to any swing trader’s toolkit. It’s not a holy grail — nothing is — but it gives you a volume-weighted reference point that standard moving averages can’t match. If you’re trading events or mean reversion, this indicator is worth the two minutes it takes to set up.
Just remember: price can stay extended longer than you can stay solvent. Always use a stop.
Go Deeper with The Indicator Lab
🔬 The Lab Report — 93 indicators. 20 markets. One consensus verdict every 15 minutes. Stop guessing which indicator to trust.
📈 The Lab Edge — Time-Series Momentum across 166 markets. The same framework institutions use. Weekly signals to your phone.
📊 Prefer to trade on your own? Power your analysis on TradingView — the platform behind every review on this site.
Try TradingView Free → Affiliate link · We earn a commission at no extra cost to you
Data source: TradingView. This review is based on publicly available indicator information and hands-on testing. Always test indicators in a demo environment before live trading.
Chart full of indicators. Still not sure which one to trust.
You just read about Anchored Vwap Review: Settings, Strategy & How to Use It. Add 10 more to your chart and you're drowning in conflicting signals. The Lab Report runs 93 indicators on 20 markets, tallies the consensus, and pings your phone every 15 minutes. Less clutter. One verdict.
Got your entries? Now what?
The Lab Edge runs Time-Series Momentum — the same framework institutions use — across 166 markets, 95% profitable in backtesting. One signal. Once a week. No indicators to configure.
🔬 Are you the developer of this indicator? Email us →