Market Structure Shift vs Break of Structure — The Signal Everyone Confuses
Market structure shift vs break of structure: BOS continues a trend, MSS ends it. The bar-by-bar test that separates them, and the labels traders get wrong.
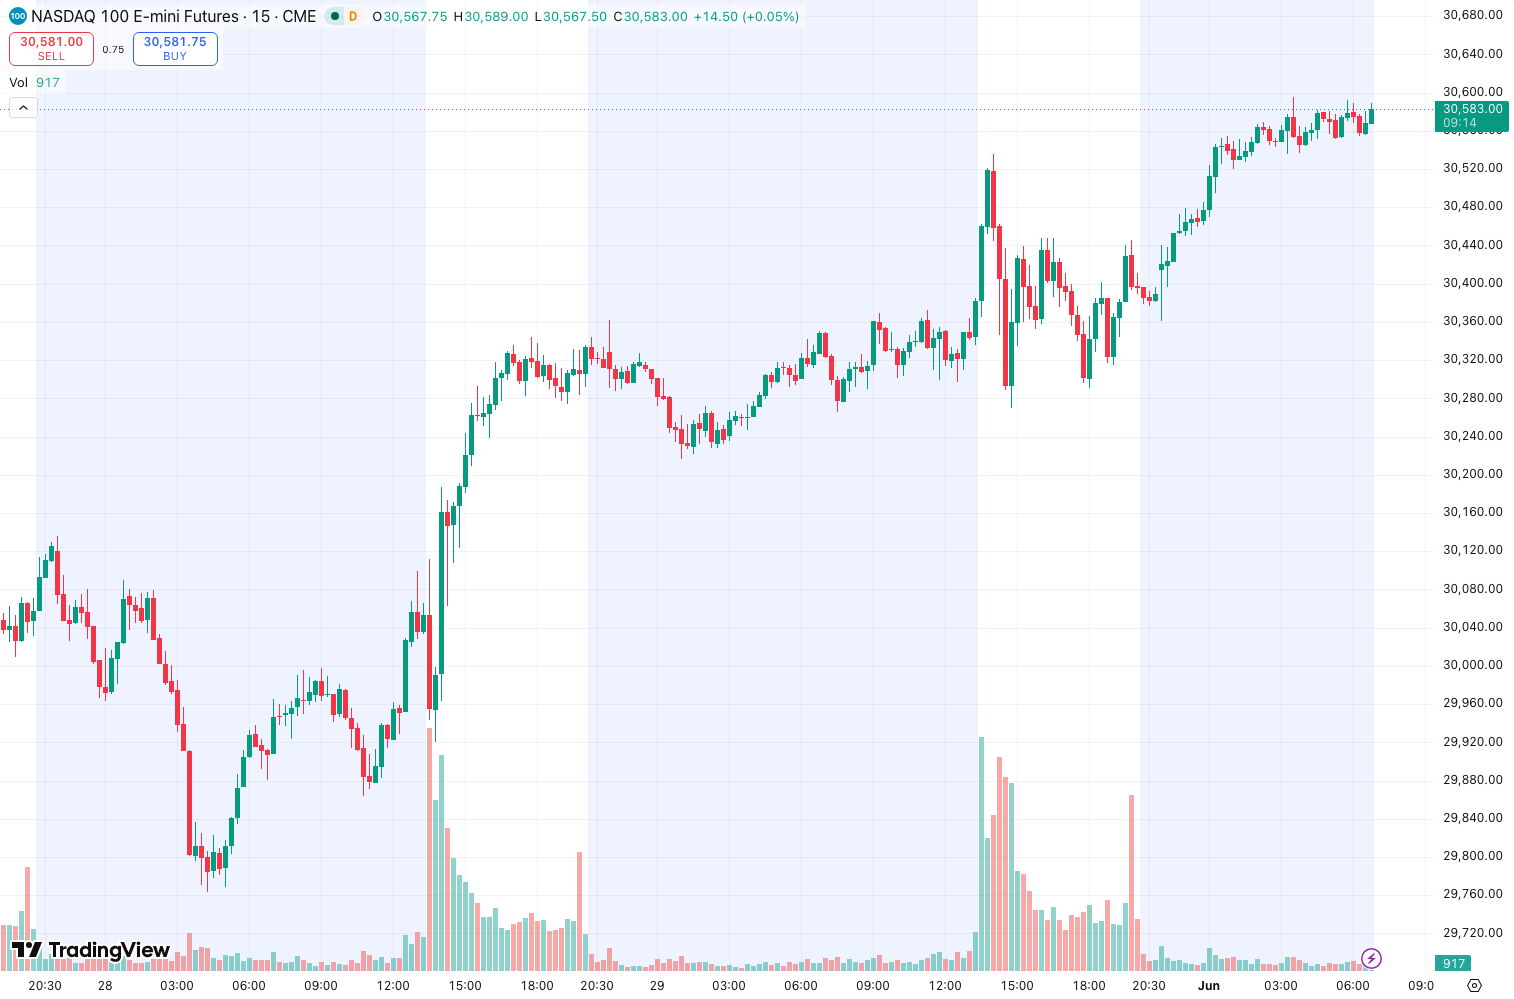
The Chart Looks Identical Because It Is
Pull up any “MSS vs BOS” explainer and you get two arrows pointing at candle closes that look exactly the same: price broke a prior swing high. One arrow is labelled continuation, the other reversal. Nobody explains why.
Here’s the part that actually resolves the confusion: a market structure shift and a break of structure are the same mechanical event. Both are a close beyond a prior swing point. The difference is which swing gets taken out — and therefore how much structure is left standing behind the break.
Stop classifying the break. Start classifying the swing.
Bar by Bar: What Each One Removes
In an uptrend you have two kinds of lows on the chart:
- The pullback low — the most recent higher low, created inside the current leg. It’s the trigger level for continuation. Take it out with a close, and the leg resumes: that’s a BOS.
- The origin low — the low that launched the entire sequence, the swing the whole uptrend is built on. Take that out with a close, and there is no invalidation level left below price. The bullish structure is gone, not paused. That’s a market structure shift.
So the test is a single question asked at the moment of the close: did this break consume the trigger or the foundation?
If the pullback low is still intact after the break lower and price reclaims, you have a BOS down inside a larger uptrend — a pullback doing pullback things. If the origin low is gone and the previous higher high now sits above unbroken price, every buyer who was “waiting for a higher low” has no higher low to buy. That’s the reversal, and it doesn’t need a second opinion.
The “change of character vs MSS” naming debate is noise with a real consequence: most traders use CHoCH for the first break against the trend and MSS for the same thing after displacement. Same event, different strictness. Pick one definition and stay consistent, because the label isn’t what pays — the invalidation level is.
Three Labels That Get Applied Wrong
The wick that closed back inside. Not an MSS. Not a BOS. A sweep. The level was tested, not consumed. Half of all “fakeout reversals” in trading Twitter are just this, mislabelled after the fact.
The internal swing. Inside every impulsive leg there are minor swings. Breaking a minor high against a minor low is an internal structure break — it changes nothing about the higher-timeframe trend. This is why auto-labelling indicators have a lookback setting and why default settings paint MSS arrows on every pullback. Set the lookback to the timeframe you’re actually trading.
The immediate reclaim. MSS confirms, then price closes back above the broken level within two or three bars. That’s a failed shift — and it usually means the move was engineered to fill orders, not to change trend. Treat the reclaim as the setup, not the failure.

The mechanical answer to all three is the same: judge on candle close, then wait for the retest. Market Structure Pro is built around exactly that hierarchy — close-confirmed breaks, sweeps flagged as separate events, and the swing sequence labelled with a lookback you control. It scored 4/5 in our testing, and the lookback is the one setting worth tuning before you trust any arrow.
For momentum context at the shift, the Market Structure Oscillator makes the divergence between the new price extreme and the structure sequence visible in a separate panel — an MSS with a violently diverging oscillator is a very different trade from one that breaks with momentum agreeing. And if you want to know where the new leg might stall rather than whether it starts, Swing Structure Forecast projects the BOS line forward with 1.272/1.618 extension zones.
The One-Line Rule
BOS takes the trigger. MSS takes the foundation. If the origin swing of the current leg is still intact, you’re trading continuation and the trend is your friend. If it’s gone, you’re in a new structure and every old level is now resistance from the wrong side.
If the basics still feel slippery, start with how to read market structure like a professional trader — anchor timeframe, close-confirmed breaks, and why wicks don’t count. This post is the next layer: once the definitions are solid, the only remaining question at every break is what it destroyed.
All indicators tested on TradingView. Run structure studies across multiple timeframes with a TradingView Pro account here.
🔬 Go Deeper Than One Indicator
Enjoyed this comparison? Get real-time consensus from 123 indicators across 20 markets — every 15 minutes, right to your phone.
7-day free trial · Cancel anytime · Affiliate link