How the Donchian Channel Breakout Works
The donchian channel breakout is one of the most widely-used signals in trading. It’s simple, mechanical, and removes emotional decision-making from your trading by generating clear entry and exit signals based on the Donchian indicator.
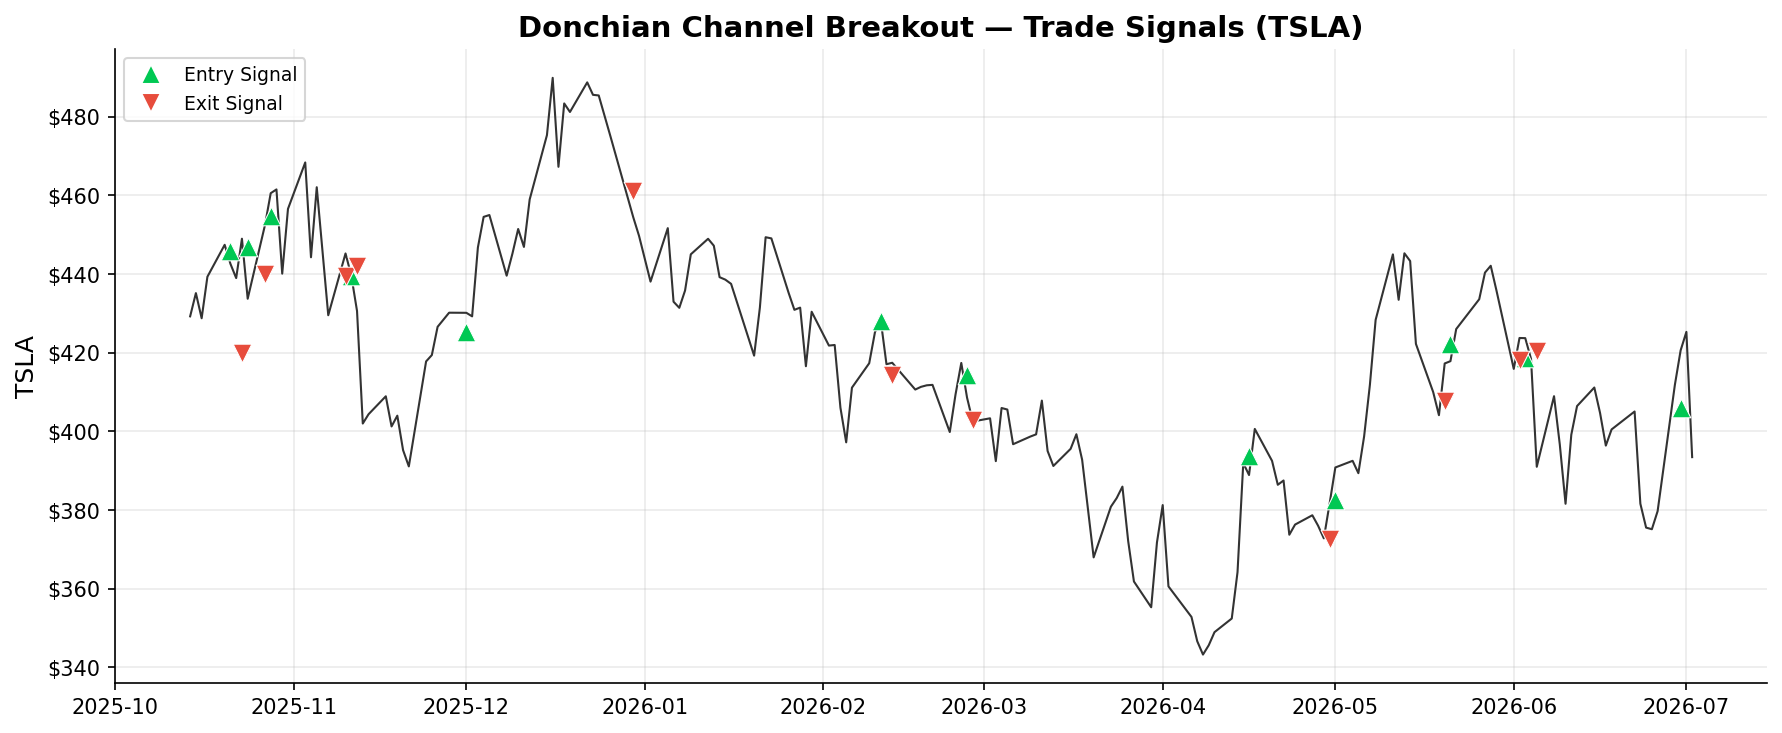
On TSLA, the Donchian acts as a trend filter. It won’t catch every exact bottom, but it reliably captures the meat of major moves while keeping you out of chop.
5-Year Performance on TSLA
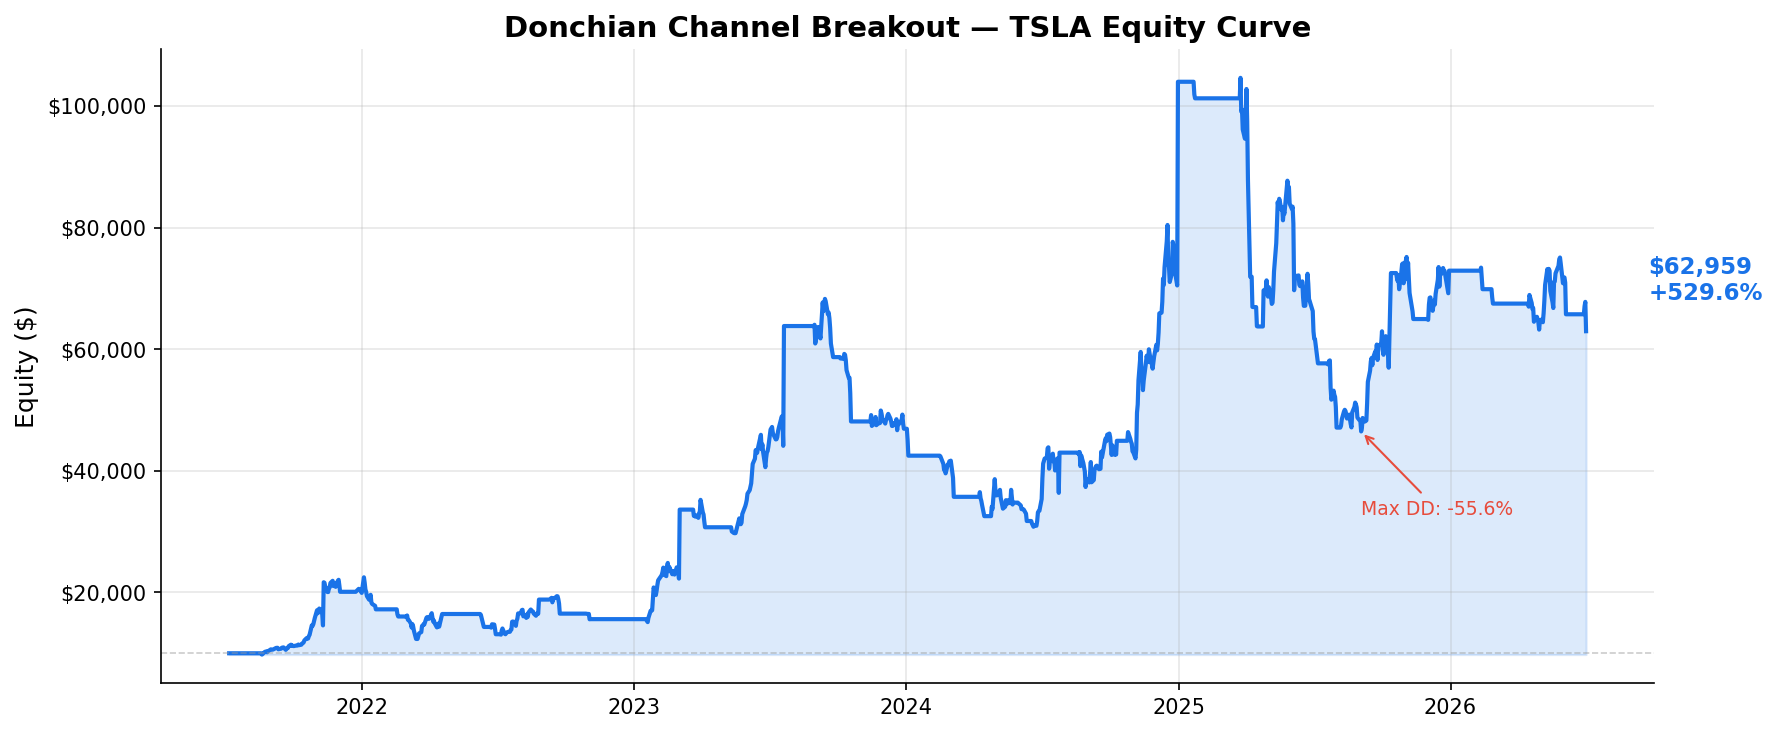
Over five years (2021-08-30 → 2026-08-28), the Donchian Channel Breakout delivered a +13.1% total return on TSLA, compounding at 2.5% annually.
At 0.16, the Donchian earned less than one units of return for every unit of risk taken. For context, anything above 1.0 is considered good; above 1.5 is excellent.
The catch? A 48.3% max drawdown. At some point during this 5-year run, you’d have been down nearly 48% from peak equity. That’s stomach-churning territory for most traders. If you can’t handle that kind of drawdown, this isn’t for you — or you need to size down.
Risk Assessment
| Metric | Value | Verdict |
|---|---|---|
| Sharpe Ratio | 0.16 | ❌ Weak |
| Max Drawdown | 48.3% | ⚠️ Significant |
| Win Rate | 29.6% | ❌ Low — relies on outsized wins |
| Profit Factor | 1.05 | ⚠️ Marginal |
| Trades/Year | ~71 total | Active |
The profit factor of 1.05 tells the real story: when the Donchian fires, the winning signals are larger than the losing ones. Combined with a 29.6% win rate, this requires careful position sizing to be profitable.
Does the Donchian Channel Breakout Work on TSLA?
The donchian channel breakout struggled to generate meaningful edge on TSLA over this 5-year period. With a 0.16 Sharpe ratio and 1.05 profit factor, the risk-adjusted returns are below what most systematic traders would consider acceptable.
This doesn’t mean the Donchian is useless — it may work better on different assets, timeframes, or when combined with other filters. But on TSLA with default parameters over 5 years, it didn’t produce a compelling standalone edge.
Our take: skip it on TSLA unless you’re combining it with other confirmations or using it on different timeframes.
Trade Stocks on Moomoo — Commission-Free
Access US markets with zero commissions and professional-grade charting tools.
The Indicator Lab is supported by readers. Some links are affiliate links — we earn a commission at no extra cost to you.
Data source: Yahoo Finance (yfinance). Backtest engine: backtrader. 95% position sizing. 0.1% commission per trade. Last refreshed: August 29, 2026. Not financial advice. Past performance does not guarantee future results.
Year-by-Year Breakdown
| Year | Return | Trades | Win Rate |
|---|---|---|---|
| 2021 | +44.6% | 5 | 29.6% |
| 2022 | -69.2% | 14 | 29.6% |
| 2023 | +129.9% | 9 | 29.6% |
| 2024 | +62.6% | 13 | 29.6% |
| 2025 | +18.6% | 19 | 29.6% |
| 2026 | -20.8% | 11 | 29.6% |
You just saw the numbers. Now get real-time consensus from 93 indicators across 20 markets — every 15 minutes, right to your phone.
Open Moomoo Account7-day free trial · Cancel anytime · Affiliate link